Lenovo 2009 Annual Report Download - page 108
Download and view the complete annual report
Please find page 108 of the 2009 Lenovo annual report below. You can navigate through the pages in the report by either clicking on the pages listed below, or by using the keyword search tool below to find specific information within the annual report.-
 1
1 -
2
-
3
-
4
-
5
-
6
-
7
-
8
-
9
-
10
-
11
-
12
-
13
-
14
-
15
-
16
-
17
-
18
-
19
-
20
-
21
-
22
-
23
-
24
-
25
-
26
-
27
-
28
-
29
-
30
-
31
-
32
-
33
-
34
-
35
-
36
-
37
-
38
-
39
-
40
-
41
-
42
-
43
-
44
-
45
-
46
-
47
-
48
-
49
-
50
-
51
-
52
-
53
-
54
-
55
-
56
-
57
-
58
-
59
-
60
-
61
-
62
-
63
-
64
-
65
-
66
-
67
-
68
-
69
-
70
-
71
-
72
-
73
-
74
-
75
-
76
-
77
-
78
-
79
-
80
-
81
-
82
-
83
-
84
-
85
-
86
-
87
-
88
-
89
-
90
-
91
-
92
-
93
-
94
-
95
-
96
-
97
-
 98
98 -
 99
99 -
 100
100 -
 101
101 -
 102
102 -
 103
103 -
 104
104 -
 105
105 -
 106
106 -
 107
107 -
 108
108 -
 109
109 -
 110
110 -
 111
111 -
 112
112 -
 113
113 -
 114
114 -
 115
115 -
 116
116 -
 117
117 -
 118
118 -
119
-
120
-
121
-
122
-
123
-
124
-
125
-
126
-
127
-
128
-
129
-
130
-
131
-
132
-
133
-
134
-
135
-
136
-
137
-
138
-
139
-
140
-
141
-
142
-
143
-
144
-
145
-
146
-
147
-
148
-
149
-
150
-
151
-
152
-
153
-
154
-
155
-
156
 |
 |
2008/09 Annual Report Lenovo Group Limited
106
NOTES TO THE FINANCIAL STATEMENTS (Continued)
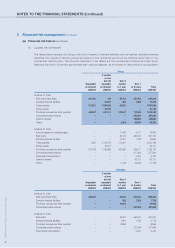
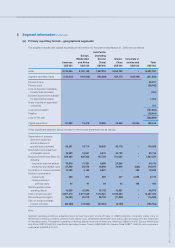
5 Segment information (continued)
(a) Primary reporting format – geographical segments (continued)
The segment assets and liabilities at March 31, 2008 are as follows:
Asia Pacific
Europe, (excluding
Middle East Greater Greater Corporate or
Americas and Africa China) China unallocated Total
US$’000 US$’000 US$’000 US$’000 US$’000 US$’000
Segment assets 1,472,775 788,664 1,213,620 2,715,799 6,190,858
Interest in associated companies 2,690
Deferred tax assets 156,440
Available-for-sale financial assets 67,697
Cash and cash equivalents 449,576
Income tax recoverable 40,002
Other unallocated assets 292,584 1,008,989
Consolidated total assets 7,199,847
Segment liabilities 1,384,307 1,029,253 933,348 1,414,180 4,761,088
Bank borrowings 500,000
Convertible preferred shares 211,181
Share-based compensation 6,430
Derivative financial liabilities 1,788
Income tax payable 87,209
Other unallocated liabilities 18,888 825,496
Consolidated total liabilities 5,586,584
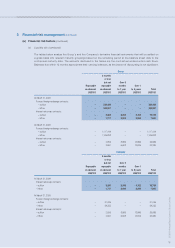
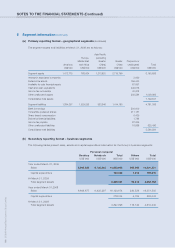
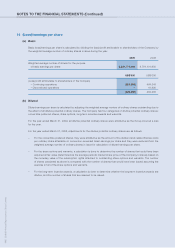
(b) Secondary reporting format – business segments
The following tables present sales, assets and capital expenditure information for the Group’s business segments:
Personal computer
Desktop Notebook Total Others Total
US$’000 US$’000 US$’000 US$’000 US$’000
Year ended March 31, 2009
Sales 5,905,620 8,730,045 14,635,665 265,686 14,901,351
Capital expenditure 192,000 1,915 193,915
At March 31, 2009
Total segment assets 3,459,441 93,312 3,552,753
Year ended March 31,2008
Sales 6,698,677 9,422,297 16,120,974 230,529 16,351,503
Capital expenditure 278,334 5,709 284,043
At March 31, 2008
Total segment assets 4,397,096 115,144 4,512,240