Lenovo 2009 Annual Report Download - page 130
Download and view the complete annual report
Please find page 130 of the 2009 Lenovo annual report below. You can navigate through the pages in the report by either clicking on the pages listed below, or by using the keyword search tool below to find specific information within the annual report.-
 1
1 -
2
-
3
-
4
-
5
-
6
-
7
-
8
-
9
-
10
-
11
-
12
-
13
-
14
-
15
-
16
-
17
-
18
-
19
-
20
-
21
-
22
-
23
-
24
-
25
-
26
-
27
-
28
-
29
-
30
-
31
-
32
-
33
-
34
-
35
-
36
-
37
-
38
-
39
-
40
-
41
-
42
-
43
-
44
-
45
-
46
-
47
-
48
-
49
-
50
-
51
-
52
-
53
-
54
-
55
-
56
-
57
-
58
-
59
-
60
-
61
-
62
-
63
-
64
-
65
-
66
-
67
-
68
-
69
-
70
-
71
-
72
-
73
-
74
-
75
-
76
-
77
-
78
-
79
-
80
-
81
-
82
-
83
-
84
-
85
-
86
-
87
-
88
-
89
-
90
-
91
-
92
-
93
-
94
-
95
-
96
-
97
-
98
-
99
-
100
-
101
-
102
-
103
-
104
-
105
-
106
-
107
-
108
-
109
-
110
-
111
-
112
-
113
-
114
-
115
-
116
-
117
-
118
-
119
-
 120
120 -
 121
121 -
 122
122 -
 123
123 -
 124
124 -
 125
125 -
 126
126 -
 127
127 -
 128
128 -
 129
129 -
 130
130 -
 131
131 -
 132
132 -
 133
133 -
 134
134 -
 135
135 -
 136
136 -
 137
137 -
 138
138 -
 139
139 -
 140
140 -
141
-
142
-
143
-
144
-
145
-
146
-
147
-
148
-
149
-
150
-
151
-
152
-
153
-
154
-
155
-
156
 |
 |

2008/09 Annual Report Lenovo Group Limited
128
NOTES TO THE FINANCIAL STATEMENTS (Continued)
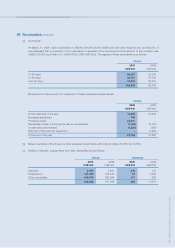
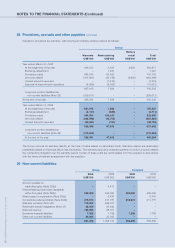
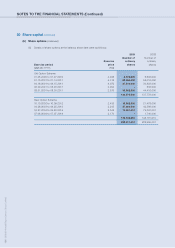
25 Receivables (continued)
(d) The carrying amounts of trade receivables, notes receivable, deposits, prepayments and other receivables approximate
their fair value. The maximum exposure to credit risk at the balance sheet date is the fair value of each class of receivable
mentioned above. The Group does not hold any collateral as security.
The carrying amounts of receivables are denominated in the following currencies:
Group Company
2009 2008 2009 2008
US$’000 US$’000 US$’000 US$’000
Renminbi 212,405 253,653 – –
United States dollar 966,355 1,424,824 62 1,939
Euro 230,351 283,667 – –
Hong Kong dollar 16,029 36,793 534 4,740
1,425,140 1,998,937 596 6,679
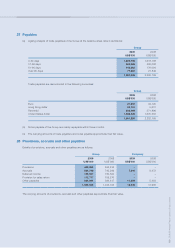
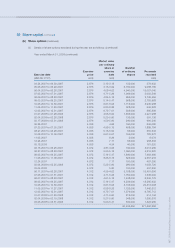
26 Bank deposits and cash and cash equivalents
Group Company
2009 2008 2009 2008
US$’000 US$’000 US$’000 US$’000
Bank deposits matured within one year – 540,058 – –
Cash and cash equivalents
– cash at bank and in hand 1,509,244 1,040,233 13,618 133,122
– money market funds 354,135 611,187 150,000 205,000
1,863,379 2,191,478 163,618 338,122
Maximum exposure to credit risk 1,863,379 2,191,478 163,618 338,122
Bank deposits and cash and cash equivalents are denominated in the following currencies:
Group Company
2009 2008 2009 2008
US$’000 US$’000 US$’000 US$’000
United States dollar 1,224,838 1,400,068 163,146 337,810
Euro 52,083 48,001 – –
Japanese Yen 34,637 62,675 109 –
Renminbi 456,337 446,154 – –
Other currencies 95,484 234,580 363 312
1,863,379 2,191,478 163,618 338,122