Lenovo 2009 Annual Report Download - page 49
Download and view the complete annual report
Please find page 49 of the 2009 Lenovo annual report below. You can navigate through the pages in the report by either clicking on the pages listed below, or by using the keyword search tool below to find specific information within the annual report.-
 1
1 -
2
-
3
-
4
-
5
-
6
-
7
-
8
-
9
-
10
-
11
-
12
-
13
-
14
-
15
-
16
-
17
-
18
-
19
-
20
-
21
-
22
-
23
-
24
-
25
-
26
-
27
-
28
-
29
-
30
-
31
-
32
-
33
-
34
-
35
-
36
-
37
-
38
-
 39
39 -
 40
40 -
 41
41 -
 42
42 -
 43
43 -
 44
44 -
 45
45 -
 46
46 -
 47
47 -
 48
48 -
 49
49 -
 50
50 -
 51
51 -
 52
52 -
 53
53 -
 54
54 -
 55
55 -
 56
56 -
 57
57 -
 58
58 -
 59
59 -
60
-
61
-
62
-
63
-
64
-
65
-
66
-
67
-
68
-
69
-
70
-
71
-
72
-
73
-
74
-
75
-
76
-
77
-
78
-
79
-
80
-
81
-
82
-
83
-
84
-
85
-
86
-
87
-
88
-
89
-
90
-
91
-
92
-
93
-
94
-
95
-
96
-
97
-
98
-
99
-
100
-
101
-
102
-
103
-
104
-
105
-
106
-
107
-
108
-
109
-
110
-
111
-
112
-
113
-
114
-
115
-
116
-
117
-
118
-
119
-
120
-
121
-
122
-
123
-
124
-
125
-
126
-
127
-
128
-
129
-
130
-
131
-
132
-
133
-
134
-
135
-
136
-
137
-
138
-
139
-
140
-
141
-
142
-
143
-
144
-
145
-
146
-
147
-
148
-
149
-
150
-
151
-
152
-
153
-
154
-
155
-
156
 |
 |

2008/09 Annual Report Lenovo Group Limited
47
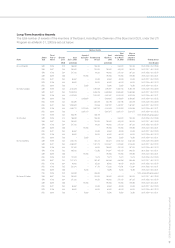
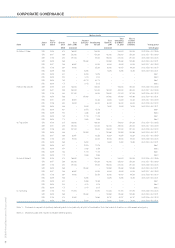
The total number of awards granted in the year (including members of the Board and employees) under the LTI
Program is set out below.
Number of units
Award type
Effective price
(HK$)
As at
April 1, 2008
Awarded during
the year
Vested during
the year
Exercised
during the year
Cancelled/
lapsed during
the year
As at
March 31, 2009
Total
outstanding as
at March 31,
2009
Max no. of
shares subject
to conditions Vesting period
(unvested) (unvested) (mm.dd.yyyy)
All directors SAR 2.35 – 5.88 49,662,178 8,180,861 17,190,685 – – 40,652,354 74,062,951 74,062,951 05.01.2006 - 06.01.2012
RSU 1.62 – 6.01 26,110,751 13,703,256 6,920,904 – – 32,893,103 32,893,103 32,893,103 05.01.2006 - 06.01.2012
PSU 2.42 1,232,695 – 1,232,695 – – – – – 100% vested with partial payout
All other
employees
SAR 1.46 – 8.07 250,155,655 281,964,784 107,982,412 22,717,711 51,354,953 372,783,074 636,919,132 636,919,132 05.01.2006 - 01.01.2013
RSU 1.38 – 8.07 168,146,541 218,220,449 75,106,865 – 61,471,698 249,788,427 270,502,871 270,502,871 05.01.2006 - 01.01.2013
PSU 2.32 – 3.73 9,750,223 – 9,655,148 – 95,075 – – –
Total SAR 1.46 – 8.07 299,817,833 290,145,645 125,173,097 22,717,711 51,354,953 413,435,428 710,982,083 710,982,083 05.01.2006 - 01.01.2013
RSU 1.38 – 8.07 194,257,292 231,923,705 82,027,769 – 61,471,698 282,681,530 303,395,974 303,395,974 05.01.2006 – 01.01.2013
PSU 2.32 – 3.73 10,982,918 – 10,887,843 – 95,075 – – – –
EXTERNAL AUDITOR
The Group’s external auditor is PricewaterhouseCoopers (“PwC”), who is remunerated mainly for its audit services
provided to the Group. The Company has adopted a policy on engagement of external auditor for non-audit services,
under which the external auditor is required to comply with the independence requirements under Code of Ethics for
Professional Accountants issued by Hong Kong Institute of Certified Public Accountants. External auditor may provide
certain non-audit services to the Group given that these do not involve any management or decision making functions
for and on behalf of the Group; or perform any self assessments; or acting in an advocacy role for the Company. The
engagement of the external auditor for permitted and approved non-audit services shall be approved by the Audit
Committee if the value of such non-audit services equals to or above US$320,000.
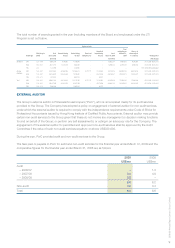
During the year, PwC provided audit and non-audit services to the Group.
The fees paid or payable to PwC for audit and non-audit services for the financial year ended March 31, 2009 and the
comparative figures for the financial year ended March 31, 2008 are as follows:
2009 2008
US$mn US$mn
Audit
– 2006/07 – 1.3
– 2007/08 0.4 4.9
– 2008/09 5.2 –
5.6 6.2
Non-audit 0.8 0.4
Total 6.4 6.6