Lenovo 2009 Annual Report Download - page 28
Download and view the complete annual report
Please find page 28 of the 2009 Lenovo annual report below. You can navigate through the pages in the report by either clicking on the pages listed below, or by using the keyword search tool below to find specific information within the annual report.-
 1
1 -
2
-
3
-
4
-
5
-
6
-
7
-
8
-
9
-
10
-
11
-
12
-
13
-
14
-
15
-
16
-
17
-
 18
18 -
 19
19 -
 20
20 -
 21
21 -
 22
22 -
 23
23 -
 24
24 -
 25
25 -
 26
26 -
 27
27 -
 28
28 -
 29
29 -
 30
30 -
 31
31 -
 32
32 -
 33
33 -
 34
34 -
 35
35 -
 36
36 -
 37
37 -
 38
38 -
39
-
40
-
41
-
42
-
43
-
44
-
45
-
46
-
47
-
48
-
49
-
50
-
51
-
52
-
53
-
54
-
55
-
56
-
57
-
58
-
59
-
60
-
61
-
62
-
63
-
64
-
65
-
66
-
67
-
68
-
69
-
70
-
71
-
72
-
73
-
74
-
75
-
76
-
77
-
78
-
79
-
80
-
81
-
82
-
83
-
84
-
85
-
86
-
87
-
88
-
89
-
90
-
91
-
92
-
93
-
94
-
95
-
96
-
97
-
98
-
99
-
100
-
101
-
102
-
103
-
104
-
105
-
106
-
107
-
108
-
109
-
110
-
111
-
112
-
113
-
114
-
115
-
116
-
117
-
118
-
119
-
120
-
121
-
122
-
123
-
124
-
125
-
126
-
127
-
128
-
129
-
130
-
131
-
132
-
133
-
134
-
135
-
136
-
137
-
138
-
139
-
140
-
141
-
142
-
143
-
144
-
145
-
146
-
147
-
148
-
149
-
150
-
151
-
152
-
153
-
154
-
155
-
156
 |
 |

MANAGEMENT’S DISCUSSION & ANALYSIS
2008/09 Annual Report Lenovo Group Limited
26
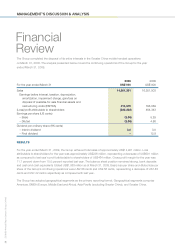
Financial
Review
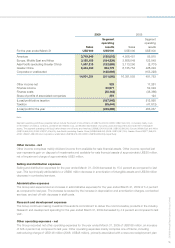
The Group completed the disposal of its entire interests in the Greater China mobile handset operations
on March 31, 2008. The analysis presented below covers the continuing operations of the Group for the year
ended March 31, 2009.
2009 2008
For the year ended March 31 US$’000 US$’000
Sales 14,901,351 16,351,503
Earnings before interest, taxation, depreciation,
amortization, impairment charge, gain/loss on
disposal of available-for-sale financial assets and
restructuring costs (EBITDA) 215,979 798,089
(Loss)/profit attributable to shareholders (226,392) 464,343
Earnings per share (US cents)
– Basic (2.56) 5.29
– Diluted (2.56) 4.86
Dividend per ordinary share (HK cents)
– Interim dividend 3.0 3.0
– Final dividend – 12.8
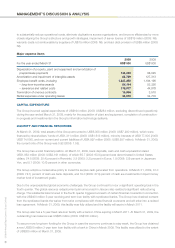
RESULTS
For the year ended March 31, 2009, the Group achieved total sales of approximately US$14,901 million. Loss
attributable to shareholders for the year was approximately US$226 million, representing a decrease of US$691 million
as compared to last year’s profit attributable to shareholders of US$464 million. Gross profit margin for the year was
11.7 percent down from 15.0 percent reported last year. The balance sheet position remained strong, bank deposits
and cash and cash equivalents totaled US$1,863 million as at March 31, 2009. Basic loss per share and diluted loss per
share of the Group’s continuing operations were US2.56 cents and US2.56 cents, representing a decrease of US7.85
cents and US7.42 cents respectively as compared with last year.
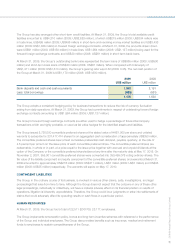
The Group has adopted geographical segments as the primary reporting format. Geographical segments comprise
Americas, EMEA (Europe, Middle East and Africa), Asia Pacific (excluding Greater China), and Greater China.