Lenovo 2009 Annual Report Download - page 116
Download and view the complete annual report
Please find page 116 of the 2009 Lenovo annual report below. You can navigate through the pages in the report by either clicking on the pages listed below, or by using the keyword search tool below to find specific information within the annual report.-
 1
1 -
2
-
3
-
4
-
5
-
6
-
7
-
8
-
9
-
10
-
11
-
12
-
13
-
14
-
15
-
16
-
17
-
18
-
19
-
20
-
21
-
22
-
23
-
24
-
25
-
26
-
27
-
28
-
29
-
30
-
31
-
32
-
33
-
34
-
35
-
36
-
37
-
38
-
39
-
40
-
41
-
42
-
43
-
44
-
45
-
46
-
47
-
48
-
49
-
50
-
51
-
52
-
53
-
54
-
55
-
56
-
57
-
58
-
59
-
60
-
61
-
62
-
63
-
64
-
65
-
66
-
67
-
68
-
69
-
70
-
71
-
72
-
73
-
74
-
75
-
76
-
77
-
78
-
79
-
80
-
81
-
82
-
83
-
84
-
85
-
86
-
87
-
88
-
89
-
90
-
91
-
92
-
93
-
94
-
95
-
96
-
97
-
98
-
99
-
100
-
101
-
102
-
103
-
104
-
105
-
 106
106 -
 107
107 -
 108
108 -
 109
109 -
 110
110 -
 111
111 -
 112
112 -
 113
113 -
 114
114 -
 115
115 -
 116
116 -
 117
117 -
 118
118 -
 119
119 -
 120
120 -
 121
121 -
 122
122 -
 123
123 -
 124
124 -
 125
125 -
 126
126 -
127
-
128
-
129
-
130
-
131
-
132
-
133
-
134
-
135
-
136
-
137
-
138
-
139
-
140
-
141
-
142
-
143
-
144
-
145
-
146
-
147
-
148
-
149
-
150
-
151
-
152
-
153
-
154
-
155
-
156
 |
 |

2008/09 Annual Report Lenovo Group Limited
114
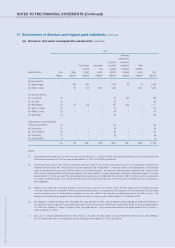
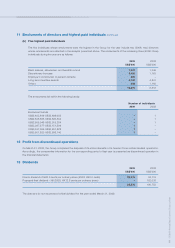
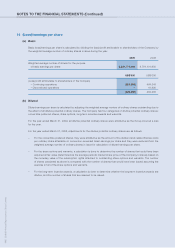
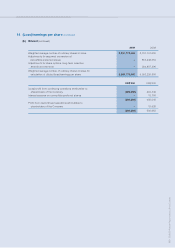
NOTES TO THE FINANCIAL STATEMENTS (Continued)
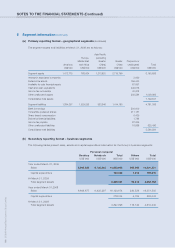
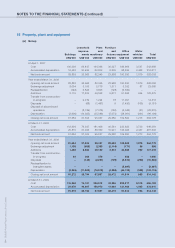
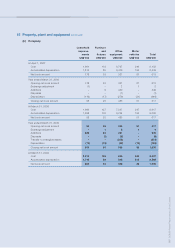
15 Property, plant and equipment
(a) Group
Leasehold Plant Furniture
improve- and and Office Motor
Buildings ments machinery fixtures equipment vehicles Total
US$’000 US$’000 US$’000 US$’000 US$’000 US$’000 US$’000
At April 1, 2007
Cost 100,336 64,447 144,348 30,327 199,664 3,547 542,669
Accumulated depreciation 16,483 30,484 62,003 6,339 98,834 2,468 216,611
Net book amount 83,853 33,963 82,345 23,988 100,830 1,079 326,058
Year ended March 31, 2008
Opening net book amount 83,853 33,963 82,345 23,988 100,830 1,079 326,058
Exchange adjustment 8,054 3,105 5,776 1,311 5,332 87 23,665
Reclassification (742) 3,825 3,605 (128) (6,560) – –
Additions 3,119 17,224 46,048 9,677 51,863 644 128,575
Transfer from construction-
in-progress – 2,019 1,224 78 11,091 – 14,412
Disposals – (68) (1,497) 9 (7,430) (165) (9,151)
Disposal of discontinued
operations – (8,739) (7,378) (182) (6,345) (31) (22,675)
Depreciation (2,600) (14,025) (35,086) (5,073) (38,981) (341) (96,106)
Closing net book amount 91,684 37,304 95,037 29,680 109,800 1,273 364,778
At March 31, 2008
Cost 112,494 74,347 181,406 40,581 233,823 3,730 646,381
Accumulated depreciation 20,810 37,043 86,369 10,901 124,023 2,457 281,603
Net book amount 91,684 37,304 95,037 29,680 109,800 1,273 364,778
Year ended March 31, 2009
Opening net book amount 91,684 37,304 95,037 29,680 109,800 1,273 364,778
Exchange adjustment 1,105 (603) 2,333 (2,114) (171) 36 586
Additions 1,466 8,660 49,152 6,613 40,863 262 107,016
Transfer from construction-
in-progress 62 388 378 – 252 – 1,080
Disposals – (146) (2,251) (709) (6,810) (290) (10,206)
Reclassification to
intangible assets – – – – (5,997) – (5,997)
Depreciation (3,045) (11,809) (76,812) (4,998) (46,123) (328) (143,115)
Closing net book amount 91,272 33,794 67,837 28,472 91,814 953 314,142
At March 31, 2009
Cost 115,948 74,761 226,812 43,096 223,217 2,318 686,152
Accumulated depreciation 24,676 40,967 158,975 14,624 131,403 1,365 372,010
Net book amount 91,272 33,794 67,837 28,472 91,814 953 314,142