Comcast 2012 Annual Report Download - page 98
Download and view the complete annual report
Please find page 98 of the 2012 Comcast annual report below. You can navigate through the pages in the report by either clicking on the pages listed below, or by using the keyword search tool below to find specific information within the annual report.-
 1
1 -
2
-
3
-
4
-
5
-
6
-
7
-
8
-
9
-
10
-
11
-
12
-
13
-
14
-
15
-
16
-
17
-
18
-
19
-
20
-
21
-
22
-
23
-
24
-
25
-
26
-
27
-
28
-
29
-
30
-
31
-
32
-
33
-
34
-
35
-
36
-
37
-
38
-
39
-
40
-
41
-
42
-
43
-
44
-
45
-
46
-
47
-
48
-
49
-
50
-
51
-
52
-
53
-
54
-
55
-
56
-
57
-
58
-
59
-
60
-
61
-
62
-
63
-
64
-
65
-
66
-
67
-
68
-
69
-
70
-
71
-
72
-
73
-
74
-
75
-
76
-
77
-
78
-
79
-
80
-
81
-
82
-
83
-
84
-
85
-
86
-
87
-
 88
88 -
 89
89 -
 90
90 -
 91
91 -
 92
92 -
 93
93 -
 94
94 -
 95
95 -
 96
96 -
 97
97 -
 98
98 -
 99
99 -
 100
100 -
 101
101 -
 102
102 -
 103
103 -
 104
104 -
 105
105 -
 106
106 -
 107
107 -
 108
108 -
109
-
110
-
111
-
112
-
113
-
114
-
115
-
116
-
117
-
118
-
119
-
120
-
121
-
122
-
123
-
124
-
125
-
126
-
127
-
128
-
129
-
130
-
131
-
132
-
133
-
134
-
135
-
136
-
137
-
138
-
139
-
140
-
141
-
142
-
143
-
144
-
145
-
146
-
147
-
148
-
149
-
150
-
151
-
152
-
153
-
154
-
155
-
156
-
157
-
158
-
159
-
160
-
161
-
162
-
163
-
164
-
165
-
166
-
167
-
168
-
169
-
170
-
171
-
172
-
173
-
174
-
175
-
176
-
177
-
178
-
179
-
180
-
181
-
182
-
183
-
184
-
185
-
186
-
187
-
188
-
189
-
190
-
191
-
192
-
193
-
194
-
195
-
196
-
197
-
198
-
199
-
200
-
201
-
202
-
203
-
204
-
205
-
206
-
207
-
208
-
209
-
210
-
211
-
212
-
213
-
214
-
215
-
216
-
217
-
218
-
219
-
220
-
221
-
222
-
223
-
224
-
225
-
226
-
227
-
228
-
229
-
230
-
231
-
232
-
233
-
234
-
235
-
236
-
237
-
238
-
239
-
240
-
241
-
242
-
243
-
244
-
245
-
246
-
247
-
248
-
249
-
250
-
251
-
252
-
253
-
254
-
255
-
256
-
257
-
258
-
259
-
260
-
261
-
262
-
263
-
264
-
265
-
266
-
267
-
268
-
269
-
270
-
271
-
272
-
273
-
274
-
275
-
276
-
277
-
278
-
279
-
280
-
281
-
282
-
283
-
284
-
285
-
286
-
287
-
288
-
289
-
290
-
291
-
292
-
293
-
294
-
295
-
296
-
297
-
298
-
299
-
300
-
301
 |
 |

Table of Contents
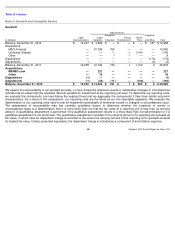
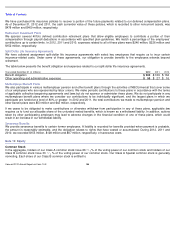
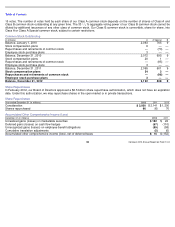
Note 8: Goodwill and Intangible Assets
Goodwill
We assess the recoverability of our goodwill annually, or more frequently whenever events or substantive changes in circumstances
indicate that an asset might be impaired. We test goodwill for impairment at the reporting unit level. To determine our reporting units,
we evaluate the components one level below the segment level and we aggregate the components if they have similar economic
characteristics. As a result of this assessment, our reporting units are the same as our five reportable segments. We evaluate the
determination of our reporting units used to test for impairment periodically or whenever events or changes in circumstances occur.
The assessment of recoverability may first consider qualitative factors to determine whether the existence of events or
circumstances leads to a determination that it is more likely than not that the fair value of a reporting unit is less than its carrying
amount. A quantitative assessment is performed if the qualitative assessment results in a more likely than not determination or if a
qualitative assessment is not performed. The quantitative assessment considers if the carrying amount of a reporting unit exceeds its
fair value, in which case an impairment charge is recorded to the extent the carrying amount of the reporting unit’
s goodwill exceeds
its implied fair value. Unless presented separately, the impairment charge is included as a component of amortization expense.
NBCUniversal
(in millions)
Cable
Communications
Cable
Networks
Broadcast
Television
Filmed
Entertainment
Theme
Parks
Corporate
and Other
Total
Balance, December 31, 2010
$
12,207
$
2,564
$
—
$
—
$
—
$
187
$
14,958
Acquisitions:
NBCUniversal
—
10,180
765
—
—
—
10,945
Universal Orlando
—
—
—
—
1,140
—
1,140
Other
—
—
7
1
—
—
8
Dispositions
—
—
—
—
—
(
174
)
(174
)
Adjustments
1
—
—
—
—
(
4
)
(3
)
Balance, December 31, 2011
12,208
12,744
772
1
1,140
9
26,874
Acquisitions:
MSNBC.com
—
227
—
—
—
—
227
Other
—
79
—
—
—
—
79
Dispositions
(1
)
—
—
—
—
—
(
1
)
Adjustments
(1
)
(24
)
(11
)
—
(
158
)
—
(
194
)
Balance, December 31, 2012
$
12,206
$
13,026
$
761
$
1
$
982
$
9
$
26,985
95
Comcast 2012 Annual Report on Form 10
-
K