Comcast 2012 Annual Report Download - page 123
Download and view the complete annual report
Please find page 123 of the 2012 Comcast annual report below. You can navigate through the pages in the report by either clicking on the pages listed below, or by using the keyword search tool below to find specific information within the annual report.-
 1
1 -
2
-
3
-
4
-
5
-
6
-
7
-
8
-
9
-
10
-
11
-
12
-
13
-
14
-
15
-
16
-
17
-
18
-
19
-
20
-
21
-
22
-
23
-
24
-
25
-
26
-
27
-
28
-
29
-
30
-
31
-
32
-
33
-
34
-
35
-
36
-
37
-
38
-
39
-
40
-
41
-
42
-
43
-
44
-
45
-
46
-
47
-
48
-
49
-
50
-
51
-
52
-
53
-
54
-
55
-
56
-
57
-
58
-
59
-
60
-
61
-
62
-
63
-
64
-
65
-
66
-
67
-
68
-
69
-
70
-
71
-
72
-
73
-
74
-
75
-
76
-
77
-
78
-
79
-
80
-
81
-
82
-
83
-
84
-
85
-
86
-
87
-
88
-
89
-
90
-
91
-
92
-
93
-
94
-
95
-
96
-
97
-
98
-
99
-
100
-
101
-
102
-
103
-
104
-
105
-
106
-
107
-
108
-
109
-
110
-
111
-
112
-
 113
113 -
 114
114 -
 115
115 -
 116
116 -
 117
117 -
 118
118 -
 119
119 -
 120
120 -
 121
121 -
 122
122 -
 123
123 -
 124
124 -
 125
125 -
 126
126 -
 127
127 -
 128
128 -
 129
129 -
 130
130 -
 131
131 -
 132
132 -
 133
133 -
134
-
135
-
136
-
137
-
138
-
139
-
140
-
141
-
142
-
143
-
144
-
145
-
146
-
147
-
148
-
149
-
150
-
151
-
152
-
153
-
154
-
155
-
156
-
157
-
158
-
159
-
160
-
161
-
162
-
163
-
164
-
165
-
166
-
167
-
168
-
169
-
170
-
171
-
172
-
173
-
174
-
175
-
176
-
177
-
178
-
179
-
180
-
181
-
182
-
183
-
184
-
185
-
186
-
187
-
188
-
189
-
190
-
191
-
192
-
193
-
194
-
195
-
196
-
197
-
198
-
199
-
200
-
201
-
202
-
203
-
204
-
205
-
206
-
207
-
208
-
209
-
210
-
211
-
212
-
213
-
214
-
215
-
216
-
217
-
218
-
219
-
220
-
221
-
222
-
223
-
224
-
225
-
226
-
227
-
228
-
229
-
230
-
231
-
232
-
233
-
234
-
235
-
236
-
237
-
238
-
239
-
240
-
241
-
242
-
243
-
244
-
245
-
246
-
247
-
248
-
249
-
250
-
251
-
252
-
253
-
254
-
255
-
256
-
257
-
258
-
259
-
260
-
261
-
262
-
263
-
264
-
265
-
266
-
267
-
268
-
269
-
270
-
271
-
272
-
273
-
274
-
275
-
276
-
277
-
278
-
279
-
280
-
281
-
282
-
283
-
284
-
285
-
286
-
287
-
288
-
289
-
290
-
291
-
292
-
293
-
294
-
295
-
296
-
297
-
298
-
299
-
300
-
301
 |
 |

Table of Contents
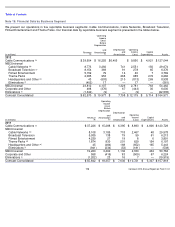
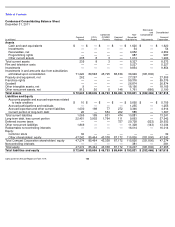
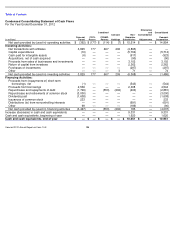
Condensed Consolidating Balance Sheet
December 31, 2011
(in millions)
Comcast
Parent
CCCL
Parent
Combined
CCHMO
Parents
Comcast
Holdings
Non-
Guarantor
Subsidiaries
Elimination
and
Consolidation
Adjustments
Consolidated
Comcast
Corporation
Assets
Cash and cash equivalents
$
—
$
—
$
—
$
—
$
1,620
$
—
$
1,620
Investments
—
—
—
—
54
—
54
Receivables, net
—
—
—
—
4,652
—
4,652
Programming rights
—
—
—
—
987
—
987
Other current assets
235
8
3
—
1,014
—
1,260
Total current assets
235
8
3
—
8,327
—
8,573
Film and television costs
—
—
—
—
5,227
—
5,227
Investments
—
—
—
—
9,854
—
9,854
Investments in and amounts due from subsidiaries
eliminated upon consolidation
71,222
89,568
45,725
88,336
36,949
(331,800
)
—
Property and equipment, net
262
—
—
—
27,297
—
27,559
Franchise rights
—
—
—
—
59,376
—
59,376
Goodwill
—
—
—
—
26,874
—
26,874
Other intangible assets, net
9
—
—
—
18,156
—
18,165
Other noncurrent assets, net
912
30
5
148
1,761
(666
)
2,190
Total assets
$
72,640
$
89,606
$
45,733
$
88,484
$
193,821
$
(332,466
)
$
157,818
Liabilities and Equity
Accounts payable and accrued expenses related
to trade creditors
$
10
$
—
$
—
$
—
$
5,695
$
—
$
5,705
Accrued participations and residuals
—
—
—
—
1,255
—
1,255
Accrued expenses and other current liabilities
1,030
189
77
272
3,346
—
4,914
Current portion of long
-
term debt
26
—
554
202
585
—
1,367
Total current liabilities
1,066
189
631
474
10,881
—
13,241
Long-term debt, less current portion
22,451
3,953
1,764
111
9,663
—
37,942
Deferred income taxes
—
—
—
727
29,728
(523
)
29,932
Other noncurrent liabilities
1,849
—
—
—
11,328
(143
)
13,034
Redeemable noncontrolling interests
—
—
—
—
16,014
—
16,014
Equity:
Common stock
32
—
—
—
—
—
32
Other shareholders
’
equity
47,242
85,464
43,338
87,172
115,826
(331,800
)
47,242
Total Comcast Corporation shareholders
’
equity
47,274
85,464
43,338
87,172
115,826
(331,800
)
47,274
Noncontrolling interests
—
—
—
—
381
—
381
Total equity
47,274
85,464
43,338
87,172
116,207
(331,800
)
47,655
Total liabilities and equity
$
72,640
$
89,606
$
45,733
$
88,484
$
193,821
$
(332,466
)
$
157,818
Comcast 2012 Annual Report on Form 10-K
120