Comcast 2012 Annual Report Download - page 120
Download and view the complete annual report
Please find page 120 of the 2012 Comcast annual report below. You can navigate through the pages in the report by either clicking on the pages listed below, or by using the keyword search tool below to find specific information within the annual report.-
 1
1 -
2
-
3
-
4
-
5
-
6
-
7
-
8
-
9
-
10
-
11
-
12
-
13
-
14
-
15
-
16
-
17
-
18
-
19
-
20
-
21
-
22
-
23
-
24
-
25
-
26
-
27
-
28
-
29
-
30
-
31
-
32
-
33
-
34
-
35
-
36
-
37
-
38
-
39
-
40
-
41
-
42
-
43
-
44
-
45
-
46
-
47
-
48
-
49
-
50
-
51
-
52
-
53
-
54
-
55
-
56
-
57
-
58
-
59
-
60
-
61
-
62
-
63
-
64
-
65
-
66
-
67
-
68
-
69
-
70
-
71
-
72
-
73
-
74
-
75
-
76
-
77
-
78
-
79
-
80
-
81
-
82
-
83
-
84
-
85
-
86
-
87
-
88
-
89
-
90
-
91
-
92
-
93
-
94
-
95
-
96
-
97
-
98
-
99
-
100
-
101
-
102
-
103
-
104
-
105
-
106
-
107
-
108
-
109
-
 110
110 -
 111
111 -
 112
112 -
 113
113 -
 114
114 -
 115
115 -
 116
116 -
 117
117 -
 118
118 -
 119
119 -
 120
120 -
 121
121 -
 122
122 -
 123
123 -
 124
124 -
 125
125 -
 126
126 -
 127
127 -
 128
128 -
 129
129 -
 130
130 -
131
-
132
-
133
-
134
-
135
-
136
-
137
-
138
-
139
-
140
-
141
-
142
-
143
-
144
-
145
-
146
-
147
-
148
-
149
-
150
-
151
-
152
-
153
-
154
-
155
-
156
-
157
-
158
-
159
-
160
-
161
-
162
-
163
-
164
-
165
-
166
-
167
-
168
-
169
-
170
-
171
-
172
-
173
-
174
-
175
-
176
-
177
-
178
-
179
-
180
-
181
-
182
-
183
-
184
-
185
-
186
-
187
-
188
-
189
-
190
-
191
-
192
-
193
-
194
-
195
-
196
-
197
-
198
-
199
-
200
-
201
-
202
-
203
-
204
-
205
-
206
-
207
-
208
-
209
-
210
-
211
-
212
-
213
-
214
-
215
-
216
-
217
-
218
-
219
-
220
-
221
-
222
-
223
-
224
-
225
-
226
-
227
-
228
-
229
-
230
-
231
-
232
-
233
-
234
-
235
-
236
-
237
-
238
-
239
-
240
-
241
-
242
-
243
-
244
-
245
-
246
-
247
-
248
-
249
-
250
-
251
-
252
-
253
-
254
-
255
-
256
-
257
-
258
-
259
-
260
-
261
-
262
-
263
-
264
-
265
-
266
-
267
-
268
-
269
-
270
-
271
-
272
-
273
-
274
-
275
-
276
-
277
-
278
-
279
-
280
-
281
-
282
-
283
-
284
-
285
-
286
-
287
-
288
-
289
-
290
-
291
-
292
-
293
-
294
-
295
-
296
-
297
-
298
-
299
-
300
-
301
 |
 |

Table of Contents
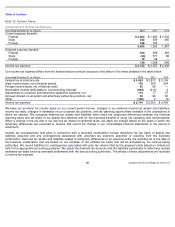
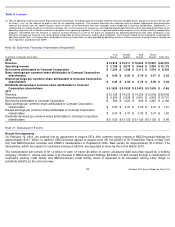
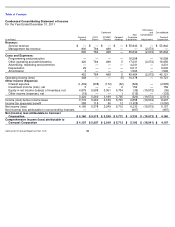
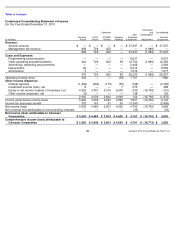
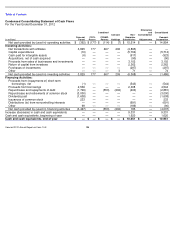
Note 20: Quarterly Financial Information (Unaudited)
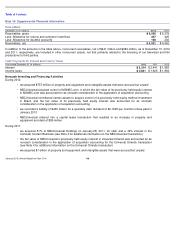
Note 21: Subsequent Events
Recent Developments
On February 12, 2013, we entered into an agreement to acquire GE’
s 49% common equity interest in NBCUniversal Holdings for
approximately $16.7 billion. In addition, NBCUniversal agreed to acquire from GE the portion of 30 Rockefeller Plaza in New York
City that NBCUniversal occupies and CNBC’
s headquarters in Englewood Cliffs, New Jersey for approximately $1.4 billion. The
transactions, which are subject to customary closing conditions, are expected to close by the end of March 2013.
The consideration will consist of $11.4 billion of cash on hand; $4 billion of senior unsecured debt securities issued by a holding
company (“HoldCo”),
whose sole asset is its interests in NBCUniversal Holdings; $2 billion of cash funded through a combination of
Comcast’s existing credit facility and NBCUniversal’
s credit facility, which is expected to be amended, among other things, to
substitute HoldCo as the sole borrower;
(h)
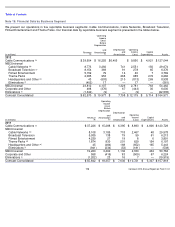
We use operating income (loss) before depreciation and amortization, excluding impairment charges related to fixed and intangible assets and gains or losses from the sale
of assets, if any, as the measure of profit or loss for our operating segments. This measure eliminates the significant level of noncash depreciation and amortization
expense that results from the capital-
intensive nature of certain of our businesses and from intangible assets recognized in business combinations. Additionally, it is
unaffected by our capital structure or investment activities. We use this measure to evaluate our consolidated operating performance and the operating performance of our
operating segments and to allocate resources and capital to our operating segments. It is also a significant performance measure in our annual incentive compensation
programs. We believe that this measure is useful to investors because it is one of the bases for comparing our operating performance with other companies in our
industries, although our measure may not be directly comparable to similar measures used by other companies. This measure should not be considered a substitute for
operating income (loss), net income (loss) attributable to Comcast Corporation, net cash provided by operating activities, or other measures of performance or liquidity we
have reported in accordance with GAAP.
(in millions, except per share data)
First
Quarter
Second
Quarter
Third
Quarter
Fourth
Quarter
Total Year
2012
Revenue
$
14,878
$
15,211
$
16,544
$
15,937
$
62,570
Operating income
$
2,758
$
3,079
$
3,048
$
3,294
$
12,179
Net income attributable to Comcast Corporation
$
1,224
$
1,348
$
2,113
$
1,518
$
6,203
Basic earnings per common share attributable to Comcast Corporation
shareholders
$
0.45
$
0.50
$
0.79
$
0.57
$
2.32
Diluted earnings per common share attributable to Comcast Corporation
shareholders
$
0.45
$
0.50
$
0.78
$
0.56
$
2.28
Dividends declared per common share attributable to Comcast
Corporation shareholders
$
0.1625
$
0.1625
$
0.1625
$
0.1625
$
0.65
2011
Revenue
$
12,128
$
14,333
$
14,339
$
15,042
$
55,842
Operating income
$
2,224
$
2,938
$
2,641
$
2,918
$
10,721
Net income attributable to Comcast Corporation
$
943
$
1,022
$
908
$
1,287
$
4,160
Basic earnings per common share attributable to Comcast Corporation
shareholders
$
0.34
$
0.37
$
0.33
$
0.47
$
1.51
Diluted earnings per common share attributable to Comcast Corporation
shareholders
$
0.34
$
0.37
$
0.33
$
0.47
$
1.50
Dividends declared per common share attributable to Comcast Corporation
shareholders
$
0.1125
$
0.1125
$
0.1125
$
0.1125
$
0.45
117
Comcast 2012 Annual Report on Form 10-
K