Comcast 2012 Annual Report Download - page 68
Download and view the complete annual report
Please find page 68 of the 2012 Comcast annual report below. You can navigate through the pages in the report by either clicking on the pages listed below, or by using the keyword search tool below to find specific information within the annual report.-
 1
1 -
2
-
3
-
4
-
5
-
6
-
7
-
8
-
9
-
10
-
11
-
12
-
13
-
14
-
15
-
16
-
17
-
18
-
19
-
20
-
21
-
22
-
23
-
24
-
25
-
26
-
27
-
28
-
29
-
30
-
31
-
32
-
33
-
34
-
35
-
36
-
37
-
38
-
39
-
40
-
41
-
42
-
43
-
44
-
45
-
46
-
47
-
48
-
49
-
50
-
51
-
52
-
53
-
54
-
55
-
56
-
57
-
 58
58 -
 59
59 -
 60
60 -
 61
61 -
 62
62 -
 63
63 -
 64
64 -
 65
65 -
 66
66 -
 67
67 -
 68
68 -
 69
69 -
 70
70 -
 71
71 -
 72
72 -
 73
73 -
 74
74 -
 75
75 -
 76
76 -
 77
77 -
 78
78 -
79
-
80
-
81
-
82
-
83
-
84
-
85
-
86
-
87
-
88
-
89
-
90
-
91
-
92
-
93
-
94
-
95
-
96
-
97
-
98
-
99
-
100
-
101
-
102
-
103
-
104
-
105
-
106
-
107
-
108
-
109
-
110
-
111
-
112
-
113
-
114
-
115
-
116
-
117
-
118
-
119
-
120
-
121
-
122
-
123
-
124
-
125
-
126
-
127
-
128
-
129
-
130
-
131
-
132
-
133
-
134
-
135
-
136
-
137
-
138
-
139
-
140
-
141
-
142
-
143
-
144
-
145
-
146
-
147
-
148
-
149
-
150
-
151
-
152
-
153
-
154
-
155
-
156
-
157
-
158
-
159
-
160
-
161
-
162
-
163
-
164
-
165
-
166
-
167
-
168
-
169
-
170
-
171
-
172
-
173
-
174
-
175
-
176
-
177
-
178
-
179
-
180
-
181
-
182
-
183
-
184
-
185
-
186
-
187
-
188
-
189
-
190
-
191
-
192
-
193
-
194
-
195
-
196
-
197
-
198
-
199
-
200
-
201
-
202
-
203
-
204
-
205
-
206
-
207
-
208
-
209
-
210
-
211
-
212
-
213
-
214
-
215
-
216
-
217
-
218
-
219
-
220
-
221
-
222
-
223
-
224
-
225
-
226
-
227
-
228
-
229
-
230
-
231
-
232
-
233
-
234
-
235
-
236
-
237
-
238
-
239
-
240
-
241
-
242
-
243
-
244
-
245
-
246
-
247
-
248
-
249
-
250
-
251
-
252
-
253
-
254
-
255
-
256
-
257
-
258
-
259
-
260
-
261
-
262
-
263
-
264
-
265
-
266
-
267
-
268
-
269
-
270
-
271
-
272
-
273
-
274
-
275
-
276
-
277
-
278
-
279
-
280
-
281
-
282
-
283
-
284
-
285
-
286
-
287
-
288
-
289
-
290
-
291
-
292
-
293
-
294
-
295
-
296
-
297
-
298
-
299
-
300
-
301
 |
 |

Table of Contents
Cash Paid for Intangible Assets
In 2012, cash paid for intangible assets consisted primarily of software. In 2011, cash paid for intangible assets consisted primarily of
software, as well as payments associated with the acquisition of intellectual property rights for use in our theme parks. Cash paid for
intangible assets was not significant in 2010.
Acquisitions
Our 2012 acquisitions were not significant. In 2011, we closed the NBCUniversal transaction and NBCUniversal acquired the
remaining 50% equity interest in Universal Orlando that it did not already own. Our 2010 acquisitions were not significant. See Note
4 to our consolidated financial statements for additional information on our acquisitions.
Proceeds from Sales of Businesses and Investments
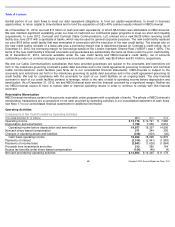
In 2012, proceeds from sales of businesses and investments consisted primarily of the A&E Television Networks transaction.
Following the close of the A&E Television Networks transaction, NBCUniversal no longer receives dividends from A&E Television
Networks. In 2012 and 2011, NBCUniversal received $129 million and $196 million, respectively, in dividends from A&E Television
Networks, which were included in net cash provided by operating activities. In 2011, proceeds from sales of businesses and
investments consisted primarily of the sale of the Philadelphia 76ers, NBCUniversal’s sale of a Spanish-
language local television
station and the sale of other investments. Proceeds from sales of businesses and investments were not significant in 2010.
Return of Capital from Investees
In 2012, return of capital from investees consisted primarily of distributions received from the SpectrumCo transaction. Our return of
capital from investees in 2011 and 2010 was not significant.
Financing Activities
Net cash used in financing activities consisted primarily of repurchases of our common stock, repayments of debt, dividend
payments, repayments of our short-term borrowings and NBCUniversal’
s distributions to GE, offset by proceeds from borrowings and
issuances of common stock. Distributions in 2012 to GE, as NBCUniversal’
s noncontrolling member, represented tax distributions
and included $211 million related to the A&E Television Networks transaction. Proceeds from borrowings fluctuate from year to year
based on the amounts paid to fund acquisitions and debt repayments.
During 2012, we issued $4.5 billion aggregate principal amount of debt, of which $2.0 billion was issued by NBCUniversal. During
2012, we repaid $781 million aggregate principal amount of our debt outstanding at maturity and we redeemed $2.1 billion aggregate
principal amount of our debt outstanding prior to maturity.
In January 2013, we issued $750 million aggregate principal amount of 2.850% senior notes due 2023, $1.7 billion aggregate
principal amount of 4.250% senior notes due 2033 and $500 million aggregate principal amount of 4.500% senior notes due 2043.
We have made, and may from time to time in the future make, optional repayments on our debt obligations, which may include
repurchases of our outstanding public notes and debentures, depending on various factors, such as market conditions.
See Note 9 to our consolidated financial statements for further discussion of our financing activities, including details of our debt
repayments and borrowings.
65
Comcast 2012 Annual Report on Form 10-
K