Comcast 2012 Annual Report Download - page 79
Download and view the complete annual report
Please find page 79 of the 2012 Comcast annual report below. You can navigate through the pages in the report by either clicking on the pages listed below, or by using the keyword search tool below to find specific information within the annual report.-
 1
1 -
2
-
3
-
4
-
5
-
6
-
7
-
8
-
9
-
10
-
11
-
12
-
13
-
14
-
15
-
16
-
17
-
18
-
19
-
20
-
21
-
22
-
23
-
24
-
25
-
26
-
27
-
28
-
29
-
30
-
31
-
32
-
33
-
34
-
35
-
36
-
37
-
38
-
39
-
40
-
41
-
42
-
43
-
44
-
45
-
46
-
47
-
48
-
49
-
50
-
51
-
52
-
53
-
54
-
55
-
56
-
57
-
58
-
59
-
60
-
61
-
62
-
63
-
64
-
65
-
66
-
67
-
68
-
 69
69 -
 70
70 -
 71
71 -
 72
72 -
 73
73 -
 74
74 -
 75
75 -
 76
76 -
 77
77 -
 78
78 -
 79
79 -
 80
80 -
 81
81 -
 82
82 -
 83
83 -
 84
84 -
 85
85 -
 86
86 -
 87
87 -
 88
88 -
 89
89 -
90
-
91
-
92
-
93
-
94
-
95
-
96
-
97
-
98
-
99
-
100
-
101
-
102
-
103
-
104
-
105
-
106
-
107
-
108
-
109
-
110
-
111
-
112
-
113
-
114
-
115
-
116
-
117
-
118
-
119
-
120
-
121
-
122
-
123
-
124
-
125
-
126
-
127
-
128
-
129
-
130
-
131
-
132
-
133
-
134
-
135
-
136
-
137
-
138
-
139
-
140
-
141
-
142
-
143
-
144
-
145
-
146
-
147
-
148
-
149
-
150
-
151
-
152
-
153
-
154
-
155
-
156
-
157
-
158
-
159
-
160
-
161
-
162
-
163
-
164
-
165
-
166
-
167
-
168
-
169
-
170
-
171
-
172
-
173
-
174
-
175
-
176
-
177
-
178
-
179
-
180
-
181
-
182
-
183
-
184
-
185
-
186
-
187
-
188
-
189
-
190
-
191
-
192
-
193
-
194
-
195
-
196
-
197
-
198
-
199
-
200
-
201
-
202
-
203
-
204
-
205
-
206
-
207
-
208
-
209
-
210
-
211
-
212
-
213
-
214
-
215
-
216
-
217
-
218
-
219
-
220
-
221
-
222
-
223
-
224
-
225
-
226
-
227
-
228
-
229
-
230
-
231
-
232
-
233
-
234
-
235
-
236
-
237
-
238
-
239
-
240
-
241
-
242
-
243
-
244
-
245
-
246
-
247
-
248
-
249
-
250
-
251
-
252
-
253
-
254
-
255
-
256
-
257
-
258
-
259
-
260
-
261
-
262
-
263
-
264
-
265
-
266
-
267
-
268
-
269
-
270
-
271
-
272
-
273
-
274
-
275
-
276
-
277
-
278
-
279
-
280
-
281
-
282
-
283
-
284
-
285
-
286
-
287
-
288
-
289
-
290
-
291
-
292
-
293
-
294
-
295
-
296
-
297
-
298
-
299
-
300
-
301
 |
 |

Table of Contents
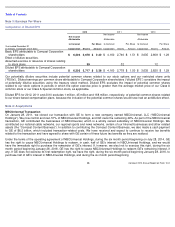
Consolidated Balance Sheet
See accompanying notes to consolidated financial statements.
December 31 (in millions, except share data)
2012
2011
Assets
Current Assets:
Cash and cash equivalents
$
10,951
$
1,620
Investments
1,464
54
Receivables, net
5,521
4,652
Programming rights
909
987
Other current assets
1,146
1,260
Total current assets
19,991
8,573
Film and television costs
5,054
5,227
Investments
6,325
9,854
Property and equipment, net
27,232
27,559
Franchise rights
59,364
59,376
Goodwill
26,985
26,874
Other intangible assets, net
17,840
18,165
Other noncurrent assets, net
2,180
2,190
Total assets
$
164,971
$
157,818
Liabilities and Equity
Current Liabilities:
Accounts payable and accrued expenses related to trade creditors
$
6,206
$
5,705
Accrued participations and residuals
1,350
1,255
Deferred revenue
851
790
Accrued expenses and other current liabilities
5,931
4,124
Current portion of long
-
term debt
2,376
1,367
Total current liabilities
16,714
13,241
Long
-
term debt, less current portion
38,082
37,942
Deferred income taxes
30,110
29,932
Other noncurrent liabilities
13,271
13,034
Commitments and contingencies (Note 18)
Redeemable noncontrolling interests
16,998
16,014
Equity:
Preferred stock
—
authorized, 20,000,000 shares; issued, zero
—
—
Class A common stock, $0.01 par value—authorized, 7,500,000,000 shares; issued, 2,487,739,385 and
2,460,937,253; outstanding, 2,122,278,635 and 2,095,476,503
25
25
Class A Special common stock, $0.01 par value—authorized, 7,500,000,000 shares; issued,
578,704,227 and 671,947,577; outstanding, 507,769,463 and 601,012,813
6
7
Class B common stock, $0.01 par value—authorized, 75,000,000 shares; issued and outstanding,
9,444,375
—
—
Additional paid
-
in capital
40,547
40,940
Retained earnings
16,280
13,971
Treasury stock, 365,460,750 Class A common shares and 70,934,764 Class A Special common shares
(7,517
)
(7,517
)
Accumulated other comprehensive income (loss)
15
(152
)
Total Comcast Corporation shareholders’ equity
49,356
47,274
Noncontrolling interests
440
381
Total equity
49,796
47,655
Total liabilities and equity
$
164,971
$
157,818
Comcast 2012 Annual Report on Form 10-K
76