Comcast 2012 Annual Report Download - page 10
Download and view the complete annual report
Please find page 10 of the 2012 Comcast annual report below. You can navigate through the pages in the report by either clicking on the pages listed below, or by using the keyword search tool below to find specific information within the annual report.-
 1
1 -
 2
2 -
 3
3 -
 4
4 -
 5
5 -
 6
6 -
 7
7 -
 8
8 -
 9
9 -
 10
10 -
 11
11 -
 12
12 -
 13
13 -
 14
14 -
 15
15 -
 16
16 -
 17
17 -
 18
18 -
 19
19 -
 20
20 -
 21
21 -
22
-
23
-
24
-
25
-
26
-
27
-
28
-
29
-
30
-
31
-
32
-
33
-
34
-
35
-
36
-
37
-
38
-
39
-
40
-
41
-
42
-
43
-
44
-
45
-
46
-
47
-
48
-
49
-
50
-
51
-
52
-
53
-
54
-
55
-
56
-
57
-
58
-
59
-
60
-
61
-
62
-
63
-
64
-
65
-
66
-
67
-
68
-
69
-
70
-
71
-
72
-
73
-
74
-
75
-
76
-
77
-
78
-
79
-
80
-
81
-
82
-
83
-
84
-
85
-
86
-
87
-
88
-
89
-
90
-
91
-
92
-
93
-
94
-
95
-
96
-
97
-
98
-
99
-
100
-
101
-
102
-
103
-
104
-
105
-
106
-
107
-
108
-
109
-
110
-
111
-
112
-
113
-
114
-
115
-
116
-
117
-
118
-
119
-
120
-
121
-
122
-
123
-
124
-
125
-
126
-
127
-
128
-
129
-
130
-
131
-
132
-
133
-
134
-
135
-
136
-
137
-
138
-
139
-
140
-
141
-
142
-
143
-
144
-
145
-
146
-
147
-
148
-
149
-
150
-
151
-
152
-
153
-
154
-
155
-
156
-
157
-
158
-
159
-
160
-
161
-
162
-
163
-
164
-
165
-
166
-
167
-
168
-
169
-
170
-
171
-
172
-
173
-
174
-
175
-
176
-
177
-
178
-
179
-
180
-
181
-
182
-
183
-
184
-
185
-
186
-
187
-
188
-
189
-
190
-
191
-
192
-
193
-
194
-
195
-
196
-
197
-
198
-
199
-
200
-
201
-
202
-
203
-
204
-
205
-
206
-
207
-
208
-
209
-
210
-
211
-
212
-
213
-
214
-
215
-
216
-
217
-
218
-
219
-
220
-
221
-
222
-
223
-
224
-
225
-
226
-
227
-
228
-
229
-
230
-
231
-
232
-
233
-
234
-
235
-
236
-
237
-
238
-
239
-
240
-
241
-
242
-
243
-
244
-
245
-
246
-
247
-
248
-
249
-
250
-
251
-
252
-
253
-
254
-
255
-
256
-
257
-
258
-
259
-
260
-
261
-
262
-
263
-
264
-
265
-
266
-
267
-
268
-
269
-
270
-
271
-
272
-
273
-
274
-
275
-
276
-
277
-
278
-
279
-
280
-
281
-
282
-
283
-
284
-
285
-
286
-
287
-
288
-
289
-
290
-
291
-
292
-
293
-
294
-
295
-
296
-
297
-
298
-
299
-
300
-
301
 |
 |

Table of Contents
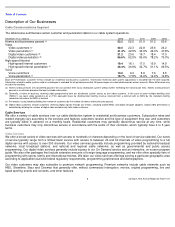
Cable Networks
Our Cable Networks segment consists of a diversified portfolio of 15 national cable networks, 11 regional sports and news networks,
various international channels, our cable television production studio, and our related digital media properties, which are primarily
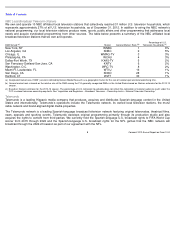
brand-aligned and other websites. The table below presents a summary of our national cable networks.
Our 11 regional sports and news networks serve a combined 39 million subscribers across the United States, including key markets
such as Atlanta, Baltimore/Washington, Boston, Chicago, Philadelphia, Portland, Sacramento and San Francisco.
We market and distribute our cable network programming in the United States and internationally to multichannel video providers, as
well as to digital distributors, such as Netflix and iTunes. These distributors may exhibit our content on television, including video on
demand and pay-per-view, online and through mobile apps for smartphones and tablets.
Our cable networks produce their own programs or acquire programming rights from third parties. Our Cable Networks segment
includes our production studio, Universal Cable Productions, which identifies, develops and produces original content for cable
television and other distribution platforms both for our cable networks and for those of third parties. We license this content to cable
networks, broadcast networks and digital distributors.
Our Cable Networks segment generates revenue primarily from the distribution of our cable network programming and from the sale
of advertising. Distribution revenue is generated from distribution agreements with multichannel video providers. Advertising revenue
is generated from the sale of advertising time on our cable networks and related digital media properties. We also generate content
licensing and other revenue primarily from the licensing of our owned programming to various distribution platforms in the United
States and internationally.
Cable Network
Approximate U.S.
Subscribers at
December 31, 2012
(in millions)
Description of Programming
USA Network
99
General entertainment
Syfy
98
Imagination
-
based entertainment
E!
97
Entertainment and pop culture
CNBC
97
Business and financial news
MSNBC
95
24 hour news
Bravo
95
Entertainment, culture and arts
Golf Channel
84
Golf competition and golf entertainment
Oxygen
79
Women
’
s interests
NBC Sports Network
78
Sports
Style
76
Lifestyle
G4
62
Gamer lifestyle
Chiller
43
Horror and suspense
CNBC World
35
Global financial news
Cloo
34
Crime, mystery and suspense
Universal HD
27
General entertainment HD programming
(a)
Subscriber data is based on The Nielsen Company’
s January 2013 report, which is derived from information available during the period December 19, 2012 through
December 25, 2012, except for Universal HD, which is derived from information provided by multichannel video providers.
7
Comcast 2012 Annual Report on Form 10-
K
(a)