Comcast 2012 Annual Report Download - page 64
Download and view the complete annual report
Please find page 64 of the 2012 Comcast annual report below. You can navigate through the pages in the report by either clicking on the pages listed below, or by using the keyword search tool below to find specific information within the annual report.-
 1
1 -
2
-
3
-
4
-
5
-
6
-
7
-
8
-
9
-
10
-
11
-
12
-
13
-
14
-
15
-
16
-
17
-
18
-
19
-
20
-
21
-
22
-
23
-
24
-
25
-
26
-
27
-
28
-
29
-
30
-
31
-
32
-
33
-
34
-
35
-
36
-
37
-
38
-
39
-
40
-
41
-
42
-
43
-
44
-
45
-
46
-
47
-
48
-
49
-
50
-
51
-
52
-
53
-
 54
54 -
 55
55 -
 56
56 -
 57
57 -
 58
58 -
 59
59 -
 60
60 -
 61
61 -
 62
62 -
 63
63 -
 64
64 -
 65
65 -
 66
66 -
 67
67 -
 68
68 -
 69
69 -
 70
70 -
 71
71 -
 72
72 -
 73
73 -
 74
74 -
75
-
76
-
77
-
78
-
79
-
80
-
81
-
82
-
83
-
84
-
85
-
86
-
87
-
88
-
89
-
90
-
91
-
92
-
93
-
94
-
95
-
96
-
97
-
98
-
99
-
100
-
101
-
102
-
103
-
104
-
105
-
106
-
107
-
108
-
109
-
110
-
111
-
112
-
113
-
114
-
115
-
116
-
117
-
118
-
119
-
120
-
121
-
122
-
123
-
124
-
125
-
126
-
127
-
128
-
129
-
130
-
131
-
132
-
133
-
134
-
135
-
136
-
137
-
138
-
139
-
140
-
141
-
142
-
143
-
144
-
145
-
146
-
147
-
148
-
149
-
150
-
151
-
152
-
153
-
154
-
155
-
156
-
157
-
158
-
159
-
160
-
161
-
162
-
163
-
164
-
165
-
166
-
167
-
168
-
169
-
170
-
171
-
172
-
173
-
174
-
175
-
176
-
177
-
178
-
179
-
180
-
181
-
182
-
183
-
184
-
185
-
186
-
187
-
188
-
189
-
190
-
191
-
192
-
193
-
194
-
195
-
196
-
197
-
198
-
199
-
200
-
201
-
202
-
203
-
204
-
205
-
206
-
207
-
208
-
209
-
210
-
211
-
212
-
213
-
214
-
215
-
216
-
217
-
218
-
219
-
220
-
221
-
222
-
223
-
224
-
225
-
226
-
227
-
228
-
229
-
230
-
231
-
232
-
233
-
234
-
235
-
236
-
237
-
238
-
239
-
240
-
241
-
242
-
243
-
244
-
245
-
246
-
247
-
248
-
249
-
250
-
251
-
252
-
253
-
254
-
255
-
256
-
257
-
258
-
259
-
260
-
261
-
262
-
263
-
264
-
265
-
266
-
267
-
268
-
269
-
270
-
271
-
272
-
273
-
274
-
275
-
276
-
277
-
278
-
279
-
280
-
281
-
282
-
283
-
284
-
285
-
286
-
287
-
288
-
289
-
290
-
291
-
292
-
293
-
294
-
295
-
296
-
297
-
298
-
299
-
300
-
301
 |
 |

Table of Contents
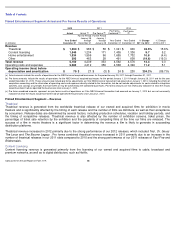
incremental marketing costs associated with the Transformers
attraction in Hollywood. Theme Parks segment pro forma combined
operating costs and expenses increased in 2011 primarily due to additional costs associated with increases in attendance and per
capita spending at our Universal theme parks.
Headquarters, Other and Eliminations
Headquarters and Other operating costs and expenses incurred by our NBCUniversal businesses include overhead, personnel costs
and corporate initiatives, as well as expenses related to the NBCUniversal transaction in 2011. Operating costs and expenses
remained flat in 2012 primarily due to higher technology and administrative costs offset by the impact of transaction-
related costs
associated with the NBCUniversal transaction, including severance and other compensation-
related costs, in 2011. Pro forma
combined operating costs and expenses increased in 2011 primarily due to these costs.
Eliminations include the results of operations for Universal Orlando for the period January 29, 2011 through June 30, 2011. Our
Theme Parks segment included the results of operations of Universal Orlando for this period because these amounts had been
reflected in our segment performance measure. These amounts were not included when we measured total NBCUniversal and our
consolidated results of operations because we recorded Universal Orlando as an equity method investment for the period
January 29, 2011 through June 30, 2011.
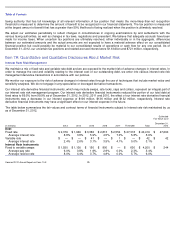
Consolidated Other Income (Expense) Items, Net
Interest Expense
Interest expense remained flat in 2012. Interest expense increased in 2011 primarily due to the effects of the NBCUniversal and
Universal Orlando transactions and the consolidation of their outstanding debt obligations.
Investment Income (Loss), Net
The components of investment income (loss), net for 2012, 2011 and 2010 are presented in a table in Note 6 to our consolidated
financial statements. We have entered into derivative financial instruments that we account for at fair value and that economically
hedge the market price fluctuations in the common stock of substantially all of our investments accounted for as trading securities
and available-for-
sale securities. The differences between the unrealized gains or losses on securities underlying prepaid forward
sale agreements and the mark to market adjustments on the derivative component of prepaid forward sale agreements result from
one or more of the following:
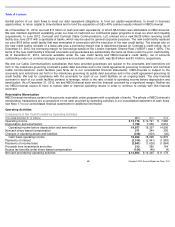
Year ended December 31 (in millions)
2012
2011
2010
Interest expense
$
(2,521
)
$
(2,505
)
$
(2,156
)
Investment income (loss), net
219
159
288
Equity in net income (losses) of investees, net
959
(35
)
(141
)
Other income (expense), net
773
(133
)
133
Total
$
(570
)
$
(2,514
)
$
(1,876
)
•
there were unusual changes in the derivative valuation assumptions such as interest rates, volatility and
dividend policy
•
the magnitude of the difference between the market price of the underlying security to which the derivative
relates and the strike price of the derivative
•
the change in the time value component of the derivative value during the period
•
the security to which the derivative relates changed due to a corporate reorganization of the issuing
company to a security with a different volatility rate
61
Comcast 2012 Annual Report on Form 10-
K