Comcast 2012 Annual Report Download - page 61
Download and view the complete annual report
Please find page 61 of the 2012 Comcast annual report below. You can navigate through the pages in the report by either clicking on the pages listed below, or by using the keyword search tool below to find specific information within the annual report.-
 1
1 -
2
-
3
-
4
-
5
-
6
-
7
-
8
-
9
-
10
-
11
-
12
-
13
-
14
-
15
-
16
-
17
-
18
-
19
-
20
-
21
-
22
-
23
-
24
-
25
-
26
-
27
-
28
-
29
-
30
-
31
-
32
-
33
-
34
-
35
-
36
-
37
-
38
-
39
-
40
-
41
-
42
-
43
-
44
-
45
-
46
-
47
-
48
-
49
-
50
-
 51
51 -
 52
52 -
 53
53 -
 54
54 -
 55
55 -
 56
56 -
 57
57 -
 58
58 -
 59
59 -
 60
60 -
 61
61 -
 62
62 -
 63
63 -
 64
64 -
 65
65 -
 66
66 -
 67
67 -
 68
68 -
 69
69 -
 70
70 -
 71
71 -
72
-
73
-
74
-
75
-
76
-
77
-
78
-
79
-
80
-
81
-
82
-
83
-
84
-
85
-
86
-
87
-
88
-
89
-
90
-
91
-
92
-
93
-
94
-
95
-
96
-
97
-
98
-
99
-
100
-
101
-
102
-
103
-
104
-
105
-
106
-
107
-
108
-
109
-
110
-
111
-
112
-
113
-
114
-
115
-
116
-
117
-
118
-
119
-
120
-
121
-
122
-
123
-
124
-
125
-
126
-
127
-
128
-
129
-
130
-
131
-
132
-
133
-
134
-
135
-
136
-
137
-
138
-
139
-
140
-
141
-
142
-
143
-
144
-
145
-
146
-
147
-
148
-
149
-
150
-
151
-
152
-
153
-
154
-
155
-
156
-
157
-
158
-
159
-
160
-
161
-
162
-
163
-
164
-
165
-
166
-
167
-
168
-
169
-
170
-
171
-
172
-
173
-
174
-
175
-
176
-
177
-
178
-
179
-
180
-
181
-
182
-
183
-
184
-
185
-
186
-
187
-
188
-
189
-
190
-
191
-
192
-
193
-
194
-
195
-
196
-
197
-
198
-
199
-
200
-
201
-
202
-
203
-
204
-
205
-
206
-
207
-
208
-
209
-
210
-
211
-
212
-
213
-
214
-
215
-
216
-
217
-
218
-
219
-
220
-
221
-
222
-
223
-
224
-
225
-
226
-
227
-
228
-
229
-
230
-
231
-
232
-
233
-
234
-
235
-
236
-
237
-
238
-
239
-
240
-
241
-
242
-
243
-
244
-
245
-
246
-
247
-
248
-
249
-
250
-
251
-
252
-
253
-
254
-
255
-
256
-
257
-
258
-
259
-
260
-
261
-
262
-
263
-
264
-
265
-
266
-
267
-
268
-
269
-
270
-
271
-
272
-
273
-
274
-
275
-
276
-
277
-
278
-
279
-
280
-
281
-
282
-
283
-
284
-
285
-
286
-
287
-
288
-
289
-
290
-
291
-
292
-
293
-
294
-
295
-
296
-
297
-
298
-
299
-
300
-
301
 |
 |

Table of Contents
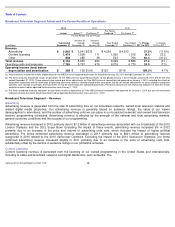
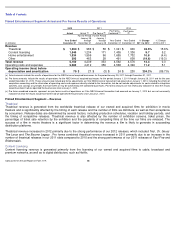
Filmed Entertainment Segment Actual and Pro Forma Results of Operations
Filmed Entertainment Segment – Revenue
Theatrical
Theatrical revenue is generated from the worldwide theatrical release of our owned and acquired films for exhibition in movie
theaters and is significantly affected by the timing of each release and the number of films we distribute, as well as their acceptance
by consumers. Release dates are determined by several factors, including production schedules, vacation and holiday periods, and
the timing of competitive releases. Theatrical revenue is also affected by the number of exhibition screens, ticket prices, the
percentage of ticket sale retention by the exhibitors and the popularity of competing films at the time our films are released. The
success of a film in movie theaters is a significant factor in determining the revenue a film is likely to generate in succeeding
distribution platforms.
Theatrical revenue increased in 2012 primarily due to the strong performance of our 2012 releases, which included Ted , Dr. Seuss
’
The Lorax and The Bourne Legacy
. Pro forma combined theatrical revenue increased in 2011 primarily due to an increase in the
number of theatrical releases in our 2011 slate compared to 2010 and the strong performance of our 2011 releases of Fast Five
and
Bridesmaids .
Content Licensing
Content licensing revenue is generated primarily from the licensing of our owned and acquired films to cable, broadcast and
premium networks, as well as to digital distributors, such as Netflix.
2012
2011
2010
Actual
Actual
Pro Forma
Pro Forma
Combined
Pro Forma
(in millions)
Year Ended
December 31
For the Period
January 29
through
December 31
For the Period
January 1
through
January 28
Year Ended
December 31
Year Ended
December 31
% Change
2011 to 2012
% Change
2010 to 2011
Revenue
Theatrical
$
1,390
$
983
$
58
$
1,041
$
900
33.5
%
15.6
%
Content licensing
1,540
1,234
171
1,405
1,336
9.7
5.2
Home entertainment
1,834
1,559
96
1,655
1,732
10.8
(4.4
)
Other
395
463
28
491
608
(19.6
)
(19.3
)
Total revenue
5,159
4,239
353
4,592
4,576
12.4
0.3
Operating costs and expenses
5,080
4,212
356
4,568
4,346
11.2
5.1
Operating income (loss) before
depreciation and amortization
$
79
$
27
$
(3
)
$
24
$
230
234.2
%
(89.7
)%
(a)
Actual amounts include the results of operations for the NBCUniversal acquired businesses for the period January 29, 2011 through December 31, 2011.
(b)
Pro forma amounts include the results of operations for the NBCUniversal acquired businesses for the period January 1, 2011 through January 28, 2011 and for the year
ended December 31, 2010. These amounts also include pro forma adjustments as if the NBCUniversal transaction had occurred on January 1, 2010, including the effects of
acquisition accounting and the elimination of operating costs and expenses directly related to the transaction, but do not include adjustments for costs related to integration
activities, cost savings or synergies that have been or may be achieved by the combined businesses. Pro forma amounts are not necessarily indicative of what the results
would have been had we operated the businesses since January 1, 2010.
(c)
Pro forma combined amounts represent our pro forma results of operations as if the NBCUniversal transaction had occurred on January 1, 2010 but are not necessarily
indicative of what the results would have been had we operated the businesses since January 1, 2010.
Comcast 2012 Annual Report on Form 10-K
58
(a) (b) (c) (b)