Comcast 2012 Annual Report Download - page 13
Download and view the complete annual report
Please find page 13 of the 2012 Comcast annual report below. You can navigate through the pages in the report by either clicking on the pages listed below, or by using the keyword search tool below to find specific information within the annual report.-
 1
1 -
2
-
 3
3 -
 4
4 -
 5
5 -
 6
6 -
 7
7 -
 8
8 -
 9
9 -
 10
10 -
 11
11 -
 12
12 -
 13
13 -
 14
14 -
 15
15 -
 16
16 -
 17
17 -
 18
18 -
 19
19 -
 20
20 -
 21
21 -
 22
22 -
 23
23 -
24
-
25
-
26
-
27
-
28
-
29
-
30
-
31
-
32
-
33
-
34
-
35
-
36
-
37
-
38
-
39
-
40
-
41
-
42
-
43
-
44
-
45
-
46
-
47
-
48
-
49
-
50
-
51
-
52
-
53
-
54
-
55
-
56
-
57
-
58
-
59
-
60
-
61
-
62
-
63
-
64
-
65
-
66
-
67
-
68
-
69
-
70
-
71
-
72
-
73
-
74
-
75
-
76
-
77
-
78
-
79
-
80
-
81
-
82
-
83
-
84
-
85
-
86
-
87
-
88
-
89
-
90
-
91
-
92
-
93
-
94
-
95
-
96
-
97
-
98
-
99
-
100
-
101
-
102
-
103
-
104
-
105
-
106
-
107
-
108
-
109
-
110
-
111
-
112
-
113
-
114
-
115
-
116
-
117
-
118
-
119
-
120
-
121
-
122
-
123
-
124
-
125
-
126
-
127
-
128
-
129
-
130
-
131
-
132
-
133
-
134
-
135
-
136
-
137
-
138
-
139
-
140
-
141
-
142
-
143
-
144
-
145
-
146
-
147
-
148
-
149
-
150
-
151
-
152
-
153
-
154
-
155
-
156
-
157
-
158
-
159
-
160
-
161
-
162
-
163
-
164
-
165
-
166
-
167
-
168
-
169
-
170
-
171
-
172
-
173
-
174
-
175
-
176
-
177
-
178
-
179
-
180
-
181
-
182
-
183
-
184
-
185
-
186
-
187
-
188
-
189
-
190
-
191
-
192
-
193
-
194
-
195
-
196
-
197
-
198
-
199
-
200
-
201
-
202
-
203
-
204
-
205
-
206
-
207
-
208
-
209
-
210
-
211
-
212
-
213
-
214
-
215
-
216
-
217
-
218
-
219
-
220
-
221
-
222
-
223
-
224
-
225
-
226
-
227
-
228
-
229
-
230
-
231
-
232
-
233
-
234
-
235
-
236
-
237
-
238
-
239
-
240
-
241
-
242
-
243
-
244
-
245
-
246
-
247
-
248
-
249
-
250
-
251
-
252
-
253
-
254
-
255
-
256
-
257
-
258
-
259
-
260
-
261
-
262
-
263
-
264
-
265
-
266
-
267
-
268
-
269
-
270
-
271
-
272
-
273
-
274
-
275
-
276
-
277
-
278
-
279
-
280
-
281
-
282
-
283
-
284
-
285
-
286
-
287
-
288
-
289
-
290
-
291
-
292
-
293
-
294
-
295
-
296
-
297
-
298
-
299
-
300
-
301
 |
 |

Table of Contents
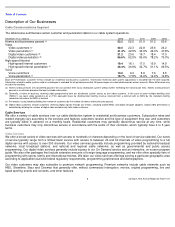
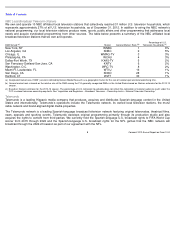
Telemundo Local Broadcast Television Stations
As of December 31, 2012, Telemundo owned 15 local television stations, including 14 local television stations affiliated with the
Telemundo network and an independent television station in Puerto Rico. The table below presents a summary of these local
television stations, which collectively reached approximately 56% of U.S. Hispanic television households as of December 31, 2012.
Filmed Entertainment
Our Filmed Entertainment segment produces, acquires, markets and distributes both live-
action and animated filmed entertainment
worldwide. We also develop, produce and license live stage plays.
We produce films both on our own and jointly with other studios or production companies, as well as with other entities. Our films are
produced primarily under the Universal Pictures, Focus Features and Illumination names. Our films are marketed and distributed
worldwide primarily through our own marketing and distribution companies. We also acquire distribution rights to films produced by
others, which may be limited to particular geographic regions, specific forms of media or certain periods of time. Our content consists
of theatrical films, direct-to-video titles and our film library, which is comprised of more than 5,000 titles in a variety of genres.
We have entered, and may continue to enter, into film cofinancing arrangements with third parties, including both studio and
nonstudio entities, to jointly finance or distribute certain of our film productions. These arrangements can take various forms, but in
most cases involve the grant of an economic interest in a film to an investor. Investors generally assume the full risks and rewards of
ownership proportionate to their ownership in the film.
DMA Served
Station
Hispanic Market Rank
Percentage of U.S.
Hispanic Television
Households
Los Angeles, CA
KVEA
1
14
%
New York, NY
WNJU
2
10
%
Miami, FL
WSCV
3
5
%
Houston, TX
KTMD
4
4
%
Dallas
-
Fort Worth, TX
KXTX
-
TV
5
4
%
Chicago, IL
WSNS
-
TV
6
4
%
San Francisco
-
Oakland
-
San Jose, CA
KSTS
7
3
%
San Antonio, TX
KVDA
8
3
%
Phoenix, AZ
KTAZ
9
3
%
Fresno, CA
KNSO
14
2
%
Denver, CO
KDEN
-
TV
16
2
%
Las Vegas, NV
KBLR
23
1
%
Boston, MA
WNEU
24
1
%
Tucson, AZ
KHRR
25
1
%
Puerto Rico
WKAQ
-
TV
—
—
(a)
DMA served is defined by Nielsen Media Research as a geographic market for the sale of national spot and local advertising time.
(b)
Hispanic market rank is based on the relative size of the DMA among approximately 14 million U.S. Hispanic households as of December 31, 2012.
(c)
Based on Nielsen estimates for the 2012-
13 season. The percentage of U.S. Hispanic television households does not reflect the calculation of national audience reach
under the FCC’s national television ownership cap limits. See “Legislation and Regulation – Broadcast Television – Ownership Limits – National Television Ownership.”
(d)
Operated by a third party that provides certain non-network programming and operations services under a time brokerage agreement.
Comcast 2012 Annual Report on Form 10
-
K
10
(a) (b) (c)
(d)
(d)
(d)