Comcast 2012 Annual Report Download - page 6
Download and view the complete annual report
Please find page 6 of the 2012 Comcast annual report below. You can navigate through the pages in the report by either clicking on the pages listed below, or by using the keyword search tool below to find specific information within the annual report.-
 1
1 -
 2
2 -
 3
3 -
 4
4 -
 5
5 -
 6
6 -
 7
7 -
 8
8 -
 9
9 -
 10
10 -
 11
11 -
 12
12 -
 13
13 -
 14
14 -
 15
15 -
 16
16 -
 17
17 -
18
-
19
-
20
-
21
-
22
-
23
-
24
-
25
-
26
-
27
-
28
-
29
-
30
-
31
-
32
-
33
-
34
-
35
-
36
-
37
-
38
-
39
-
40
-
41
-
42
-
43
-
44
-
45
-
46
-
47
-
48
-
49
-
50
-
51
-
52
-
53
-
54
-
55
-
56
-
57
-
58
-
59
-
60
-
61
-
62
-
63
-
64
-
65
-
66
-
67
-
68
-
69
-
70
-
71
-
72
-
73
-
74
-
75
-
76
-
77
-
78
-
79
-
80
-
81
-
82
-
83
-
84
-
85
-
86
-
87
-
88
-
89
-
90
-
91
-
92
-
93
-
94
-
95
-
96
-
97
-
98
-
99
-
100
-
101
-
102
-
103
-
104
-
105
-
106
-
107
-
108
-
109
-
110
-
111
-
112
-
113
-
114
-
115
-
116
-
117
-
118
-
119
-
120
-
121
-
122
-
123
-
124
-
125
-
126
-
127
-
128
-
129
-
130
-
131
-
132
-
133
-
134
-
135
-
136
-
137
-
138
-
139
-
140
-
141
-
142
-
143
-
144
-
145
-
146
-
147
-
148
-
149
-
150
-
151
-
152
-
153
-
154
-
155
-
156
-
157
-
158
-
159
-
160
-
161
-
162
-
163
-
164
-
165
-
166
-
167
-
168
-
169
-
170
-
171
-
172
-
173
-
174
-
175
-
176
-
177
-
178
-
179
-
180
-
181
-
182
-
183
-
184
-
185
-
186
-
187
-
188
-
189
-
190
-
191
-
192
-
193
-
194
-
195
-
196
-
197
-
198
-
199
-
200
-
201
-
202
-
203
-
204
-
205
-
206
-
207
-
208
-
209
-
210
-
211
-
212
-
213
-
214
-
215
-
216
-
217
-
218
-
219
-
220
-
221
-
222
-
223
-
224
-
225
-
226
-
227
-
228
-
229
-
230
-
231
-
232
-
233
-
234
-
235
-
236
-
237
-
238
-
239
-
240
-
241
-
242
-
243
-
244
-
245
-
246
-
247
-
248
-
249
-
250
-
251
-
252
-
253
-
254
-
255
-
256
-
257
-
258
-
259
-
260
-
261
-
262
-
263
-
264
-
265
-
266
-
267
-
268
-
269
-
270
-
271
-
272
-
273
-
274
-
275
-
276
-
277
-
278
-
279
-
280
-
281
-
282
-
283
-
284
-
285
-
286
-
287
-
288
-
289
-
290
-
291
-
292
-
293
-
294
-
295
-
296
-
297
-
298
-
299
-
300
-
301
 |
 |

Table of Contents
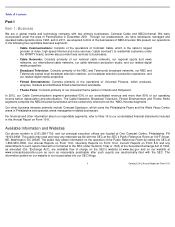
Description of Our Businesses
Cable Communications Segment
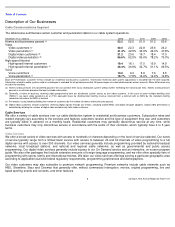
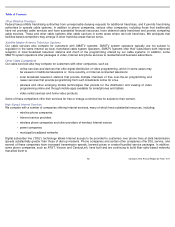
The table below summarizes certain customer and penetration data for our cable system operations.
Basis of Presentation: Customer metrics include our residential and business customers. Information related to cable system acquisitions is included from the date acquired.
Information related to cable systems sold or exchanged is excluded for all periods presented. All percentages are calculated based on actual amounts. Minor differences may
exist due to rounding.
Cable Services
We offer a variety of cable services over our cable distribution system to residential and business customers. Subscription rates and
related charges vary according to the services and features customers receive and the type of equipment they use, and customers
are typically billed in advance on a monthly basis. Residential customers may generally discontinue service at any time, while
business customers may only discontinue service in accordance with the terms of their contracts, which typically have 2 to 5 year
terms.
Video Services
We offer a broad variety of video services with access to hundreds of channels depending on the level of service selected. Our levels
of service typically range from a limited basic service with access to between 20 and 40 channels of video programming to a full
digital service with access to over 300 channels. Our video services generally include programming provided by national broadcast
networks, local broadcast stations, and national and regional cable networks, as well as governmental and public access
programming. Our digital video services generally include access to our On Demand service and an interactive, on-
screen program
guide. We also offer packages that include extensive amounts of foreign-
language programming, and we offer other specialty tiers of
programming with sports, family and international themes. We tailor our video services offerings serving a particular geographic area
according to applicable local and federal regulatory requirements, programming preferences and demographics.
Our video customers may also subscribe to premium network programming. Premium networks include cable networks such as
HBO, Showtime, Starz and Cinemax that generally offer, without commercial interruption, movies, original programming, live and
taped sporting events and concerts, and other features.
December 31 (in millions)
2012
2011
2010
2009
2008
Homes and businesses passed
53.2
52.5
51.9
51.2
50.6
Video
Video customers
22.0
22.3
22.8
23.6
24.2
Video penetration
41.4
%
42.5
%
43.9
%
46.0
%
47.8
%
Digital video customers
21.2
20.6
19.7
18.4
17.0
Digital video penetration
96.6
%
92.0
%
86.6
%
78.2
%
70.3
%
High
-
speed Internet
High-speed Internet customers
19.4
18.1
17.0
15.9
14.9
High-speed Internet penetration
36.4
%
34.6
%
32.7
%
31.1
%
29.5
%
Voice
Voice customers
10.0
9.3
8.6
7.6
6.5
Voice penetration
18.7
%
17.8
%
16.6
%
14.9
%
12.8
%
(a)
Homes and businesses are considered passed if we can connect them to our distribution system without further extending the transmission lines. Homes and businesses
passed is an estimate based on the best available information.
(b)
Generally, a home or business receiving video programming from our distribution system counts as one video customer. In the case of some multiple dwelling units
(“MDUs”),
we count video customers on an FCC equivalent basis by dividing total monthly revenue received from a contract with an MDU by the standard monthly
residential rate where the MDU is located.
(c)
Penetration is calculated by dividing the number of customers by the number of homes and businesses passed.
(d)
Digital video customers include customers receiving digital signals through any means, including CableCARDs and digital transport adapters. Digital video penetration is
calculated by dividing the number of digital video customers by total video customers.
3
Comcast 2012 Annual Report on Form 10-
K
(a)
(b)
(c)
(d)
(d)
(c)
(c)