Comcast 2012 Annual Report Download - page 94
Download and view the complete annual report
Please find page 94 of the 2012 Comcast annual report below. You can navigate through the pages in the report by either clicking on the pages listed below, or by using the keyword search tool below to find specific information within the annual report.-
 1
1 -
2
-
3
-
4
-
5
-
6
-
7
-
8
-
9
-
10
-
11
-
12
-
13
-
14
-
15
-
16
-
17
-
18
-
19
-
20
-
21
-
22
-
23
-
24
-
25
-
26
-
27
-
28
-
29
-
30
-
31
-
32
-
33
-
34
-
35
-
36
-
37
-
38
-
39
-
40
-
41
-
42
-
43
-
44
-
45
-
46
-
47
-
48
-
49
-
50
-
51
-
52
-
53
-
54
-
55
-
56
-
57
-
58
-
59
-
60
-
61
-
62
-
63
-
64
-
65
-
66
-
67
-
68
-
69
-
70
-
71
-
72
-
73
-
74
-
75
-
76
-
77
-
78
-
79
-
80
-
81
-
82
-
83
-
 84
84 -
 85
85 -
 86
86 -
 87
87 -
 88
88 -
 89
89 -
 90
90 -
 91
91 -
 92
92 -
 93
93 -
 94
94 -
 95
95 -
 96
96 -
 97
97 -
 98
98 -
 99
99 -
 100
100 -
 101
101 -
 102
102 -
 103
103 -
 104
104 -
105
-
106
-
107
-
108
-
109
-
110
-
111
-
112
-
113
-
114
-
115
-
116
-
117
-
118
-
119
-
120
-
121
-
122
-
123
-
124
-
125
-
126
-
127
-
128
-
129
-
130
-
131
-
132
-
133
-
134
-
135
-
136
-
137
-
138
-
139
-
140
-
141
-
142
-
143
-
144
-
145
-
146
-
147
-
148
-
149
-
150
-
151
-
152
-
153
-
154
-
155
-
156
-
157
-
158
-
159
-
160
-
161
-
162
-
163
-
164
-
165
-
166
-
167
-
168
-
169
-
170
-
171
-
172
-
173
-
174
-
175
-
176
-
177
-
178
-
179
-
180
-
181
-
182
-
183
-
184
-
185
-
186
-
187
-
188
-
189
-
190
-
191
-
192
-
193
-
194
-
195
-
196
-
197
-
198
-
199
-
200
-
201
-
202
-
203
-
204
-
205
-
206
-
207
-
208
-
209
-
210
-
211
-
212
-
213
-
214
-
215
-
216
-
217
-
218
-
219
-
220
-
221
-
222
-
223
-
224
-
225
-
226
-
227
-
228
-
229
-
230
-
231
-
232
-
233
-
234
-
235
-
236
-
237
-
238
-
239
-
240
-
241
-
242
-
243
-
244
-
245
-
246
-
247
-
248
-
249
-
250
-
251
-
252
-
253
-
254
-
255
-
256
-
257
-
258
-
259
-
260
-
261
-
262
-
263
-
264
-
265
-
266
-
267
-
268
-
269
-
270
-
271
-
272
-
273
-
274
-
275
-
276
-
277
-
278
-
279
-
280
-
281
-
282
-
283
-
284
-
285
-
286
-
287
-
288
-
289
-
290
-
291
-
292
-
293
-
294
-
295
-
296
-
297
-
298
-
299
-
300
-
301
 |
 |

Table of Contents
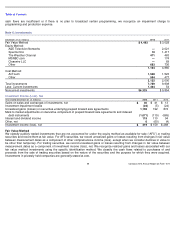
cash flows are insufficient or if there is no plan to broadcast certain programming, we recognize an impairment charge to
programming and production expense.
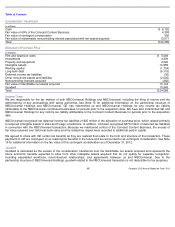
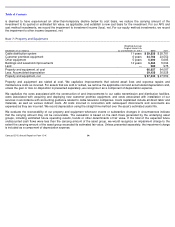
Note 6: Investments
Investment Income (Loss), Net
Fair Value Method
We classify publicly traded investments that are not accounted for under the equity method as available-for-sale (“AFS”)
or trading
securities and record them at fair value. For AFS securities, we record unrealized gains or losses resulting from changes in fair value
between measurement dates as a component of other comprehensive income (loss), except when we consider declines in value to
be other than temporary. For trading securities, we record unrealized gains or losses resulting from changes in fair value between
measurement dates as a component of investment income (loss), net. We recognize realized gains and losses associated with our
fair value method investments using the specific identification method. We classify the cash flows related to purchases of and
proceeds from the sale of trading securities based on the nature of the securities and the purpose for which they were acquired.
Investments in privately held companies are generally stated at cost.
December 31 (in millions)
2012
2011
Fair Value Method
$ 4,493
$
3,028
Equity Method:
A&E Television Networks
—
2,021
SpectrumCo
10
1,417
The Weather Channel
471
463
MSNBC.com
—
174
Clearwire LLC
—
69
Other
683
736
1,164
4,880
Cost Method:
AirTouch
1,538
1,523
Other
594
477
2,132
2,000
Total investments
7,789
9,908
Less: Current investments
1,464
54
Noncurrent investments
$6,325
$
9,854
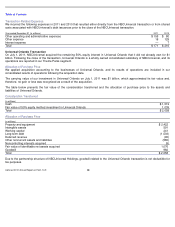
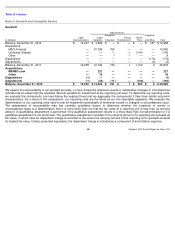
Year ended December 31 (in millions)
2012
2011
2010
Gains on sales and exchanges of investments, net
$
30
$
41
$
13
Investment impairment losses
(24
)
(5
)
(24
)
Unrealized gains (losses) on securities underlying prepaid forward sale agreements
1,159
192
874
Mark to market adjustments on derivative component of prepaid forward sale agreements and indexed
debt instruments
(1,071
)
(119
)
(665
)
Interest and dividend income
119
110
94
Other, net
6
(60
)
(4
)
Investment income (loss), net
$
219
$
159
$
288
91
Comcast 2012 Annual Report on Form 10-
K