Comcast 2012 Annual Report Download - page 83
Download and view the complete annual report
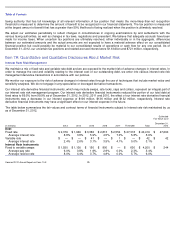
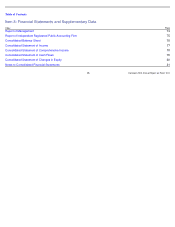
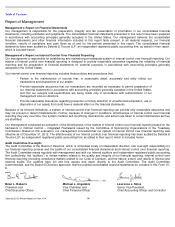
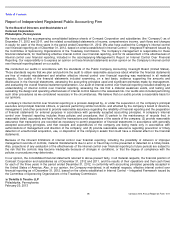
Please find page 83 of the 2012 Comcast annual report below. You can navigate through the pages in the report by either clicking on the pages listed below, or by using the keyword search tool below to find specific information within the annual report.-
 1
1 -
2
-
3
-
4
-
5
-
6
-
7
-
8
-
9
-
10
-
11
-
12
-
13
-
14
-
15
-
16
-
17
-
18
-
19
-
20
-
21
-
22
-
23
-
24
-
25
-
26
-
27
-
28
-
29
-
30
-
31
-
32
-
33
-
34
-
35
-
36
-
37
-
38
-
39
-
40
-
41
-
42
-
43
-
44
-
45
-
46
-
47
-
48
-
49
-
50
-
51
-
52
-
53
-
54
-
55
-
56
-
57
-
58
-
59
-
60
-
61
-
62
-
63
-
64
-
65
-
66
-
67
-
68
-
69
-
70
-
71
-
72
-
 73
73 -
 74
74 -
 75
75 -
 76
76 -
 77
77 -
 78
78 -
 79
79 -
 80
80 -
 81
81 -
 82
82 -
 83
83 -
 84
84 -
 85
85 -
 86
86 -
 87
87 -
 88
88 -
 89
89 -
 90
90 -
 91
91 -
 92
92 -
 93
93 -
94
-
95
-
96
-
97
-
98
-
99
-
100
-
101
-
102
-
103
-
104
-
105
-
106
-
107
-
108
-
109
-
110
-
111
-
112
-
113
-
114
-
115
-
116
-
117
-
118
-
119
-
120
-
121
-
122
-
123
-
124
-
125
-
126
-
127
-
128
-
129
-
130
-
131
-
132
-
133
-
134
-
135
-
136
-
137
-
138
-
139
-
140
-
141
-
142
-
143
-
144
-
145
-
146
-
147
-
148
-
149
-
150
-
151
-
152
-
153
-
154
-
155
-
156
-
157
-
158
-
159
-
160
-
161
-
162
-
163
-
164
-
165
-
166
-
167
-
168
-
169
-
170
-
171
-
172
-
173
-
174
-
175
-
176
-
177
-
178
-
179
-
180
-
181
-
182
-
183
-
184
-
185
-
186
-
187
-
188
-
189
-
190
-
191
-
192
-
193
-
194
-
195
-
196
-
197
-
198
-
199
-
200
-
201
-
202
-
203
-
204
-
205
-
206
-
207
-
208
-
209
-
210
-
211
-
212
-
213
-
214
-
215
-
216
-
217
-
218
-
219
-
220
-
221
-
222
-
223
-
224
-
225
-
226
-
227
-
228
-
229
-
230
-
231
-
232
-
233
-
234
-
235
-
236
-
237
-
238
-
239
-
240
-
241
-
242
-
243
-
244
-
245
-
246
-
247
-
248
-
249
-
250
-
251
-
252
-
253
-
254
-
255
-
256
-
257
-
258
-
259
-
260
-
261
-
262
-
263
-
264
-
265
-
266
-
267
-
268
-
269
-
270
-
271
-
272
-
273
-
274
-
275
-
276
-
277
-
278
-
279
-
280
-
281
-
282
-
283
-
284
-
285
-
286
-
287
-
288
-
289
-
290
-
291
-
292
-
293
-
294
-
295
-
296
-
297
-
298
-
299
-
300
-
301
 |
 |

Table of Contents
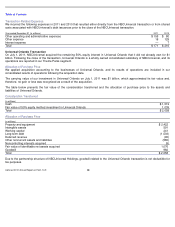
Consolidated Statement of Changes in Equity
See accompanying notes to consolidated financial statements.
(in millions)
Redeemable
Non-
controlling
Interests
Common Stock
Additional
Paid-In
Capital
Retained
Earnings
Treasury
Stock at
Cost
Accumulated
Other
Comprehensive
Income (Loss)
Non-
controlling
Interests
Total
Equity
A
A
Special
B
Balance, January 1, 2010
$
166
$
24
$
8
$
—
$
40,247
$
10,005
$
(7,517
)
$
(46
)
$
90
$
42,811
Stock compensation plans
242
(4
)
238
Repurchases and retirements of
common stock
(781
)
(419
)
(1,200
)
Employee stock purchase plan
61
61
Dividends declared
(1,059
)
(1,059
)
Other comprehensive income
(loss)
(53
)
(53
)
Sale (purchase) of subsidiary
shares to (from) noncontrolling
interests, net
(20
)
11
11
Contributions from (distributions
to) noncontrolling interests, net
(2
)
(44
)
(44
)
Net income (loss)
(1
)
3,635
34
3,669
Balance, December 31, 2010
143
24
8
—
39,780
12,158
(7,517
)
(99
)
80
44,434
Stock compensation plans
1
509
(41
)
469
Repurchases and retirements of
common stock
(1
)
(1,067
)
(1,073
)
(2,141
)
Employee stock purchase plans
68
68
Dividends declared
(1,233
)
(1,233
)
Other comprehensive income
(loss)
(38
)
(53
)
(53
)
NBCUniversal transaction
15,198
1,605
264
1,869
Issuance of subsidiary shares to
noncontrolling interests
83
45
43
88
Contributions from (distributions
to) noncontrolling interests, net
(214
)
(161
)
(161
)
Net income (loss)
842
4,160
155
4,315
Balance, December 31, 2011
16,014
25
7
—
40,940
13,971
(7,517
)
(152
)
381
47,655
Stock compensation plans
612
(240
)
372
Repurchases and retirements
of common stock
(1
)
(1,081
)
(1,918
)
(3,000
)
Employee stock purchase
plans
80
80
Dividends declared
(1,736
)
(1,736
)
Other comprehensive income
(loss)
6
167
167
Contributions from
(distributions
to) noncontrolling interests, net
(493
)
(169
)
(169
)
Other
(43
)
(4
)
80
76
Net income (loss)
1,514
6,203
148
6,351
Balance, December 31, 2012
$
16,998
$
25
$
6
$
—
$
40,547
$
16,280
$
(7,517
)
$
15
$
440
$
49,796
Comcast 2012 Annual Report on Form 10-K
80