Comcast 2012 Annual Report Download - page 12
Download and view the complete annual report
Please find page 12 of the 2012 Comcast annual report below. You can navigate through the pages in the report by either clicking on the pages listed below, or by using the keyword search tool below to find specific information within the annual report.-
 1
1 -
 2
2 -
 3
3 -
 4
4 -
 5
5 -
 6
6 -
 7
7 -
 8
8 -
 9
9 -
 10
10 -
 11
11 -
 12
12 -
 13
13 -
 14
14 -
 15
15 -
 16
16 -
 17
17 -
 18
18 -
 19
19 -
 20
20 -
 21
21 -
 22
22 -
23
-
24
-
25
-
26
-
27
-
28
-
29
-
30
-
31
-
32
-
33
-
34
-
35
-
36
-
37
-
38
-
39
-
40
-
41
-
42
-
43
-
44
-
45
-
46
-
47
-
48
-
49
-
50
-
51
-
52
-
53
-
54
-
55
-
56
-
57
-
58
-
59
-
60
-
61
-
62
-
63
-
64
-
65
-
66
-
67
-
68
-
69
-
70
-
71
-
72
-
73
-
74
-
75
-
76
-
77
-
78
-
79
-
80
-
81
-
82
-
83
-
84
-
85
-
86
-
87
-
88
-
89
-
90
-
91
-
92
-
93
-
94
-
95
-
96
-
97
-
98
-
99
-
100
-
101
-
102
-
103
-
104
-
105
-
106
-
107
-
108
-
109
-
110
-
111
-
112
-
113
-
114
-
115
-
116
-
117
-
118
-
119
-
120
-
121
-
122
-
123
-
124
-
125
-
126
-
127
-
128
-
129
-
130
-
131
-
132
-
133
-
134
-
135
-
136
-
137
-
138
-
139
-
140
-
141
-
142
-
143
-
144
-
145
-
146
-
147
-
148
-
149
-
150
-
151
-
152
-
153
-
154
-
155
-
156
-
157
-
158
-
159
-
160
-
161
-
162
-
163
-
164
-
165
-
166
-
167
-
168
-
169
-
170
-
171
-
172
-
173
-
174
-
175
-
176
-
177
-
178
-
179
-
180
-
181
-
182
-
183
-
184
-
185
-
186
-
187
-
188
-
189
-
190
-
191
-
192
-
193
-
194
-
195
-
196
-
197
-
198
-
199
-
200
-
201
-
202
-
203
-
204
-
205
-
206
-
207
-
208
-
209
-
210
-
211
-
212
-
213
-
214
-
215
-
216
-
217
-
218
-
219
-
220
-
221
-
222
-
223
-
224
-
225
-
226
-
227
-
228
-
229
-
230
-
231
-
232
-
233
-
234
-
235
-
236
-
237
-
238
-
239
-
240
-
241
-
242
-
243
-
244
-
245
-
246
-
247
-
248
-
249
-
250
-
251
-
252
-
253
-
254
-
255
-
256
-
257
-
258
-
259
-
260
-
261
-
262
-
263
-
264
-
265
-
266
-
267
-
268
-
269
-
270
-
271
-
272
-
273
-
274
-
275
-
276
-
277
-
278
-
279
-
280
-
281
-
282
-
283
-
284
-
285
-
286
-
287
-
288
-
289
-
290
-
291
-
292
-
293
-
294
-
295
-
296
-
297
-
298
-
299
-
300
-
301
 |
 |

Table of Contents
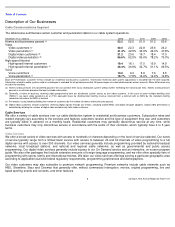
NBC Local Broadcast Television Stations
We own and operate 10 NBC affiliated local television stations that collectively reached 31 million U.S. television households, which
represents approximately 27% of all U.S. television households, as of December 31, 2012. In addition to airing the NBC network’
s
national programming, our local television stations produce news, sports, public affairs and other programming that addresses local
needs and acquire syndicated programming from other sources. The table below presents a summary of the NBC affiliated local
broadcast television stations that we own and operate.
Telemundo
Telemundo is a leading Hispanic media company that produces, acquires and distributes Spanish-
language content in the United
States and internationally. Telemundo’
s operations include the Telemundo network, its owned local television stations, the mun2
cable network and brand-aligned digital media properties.
The Telemundo network is a leading Spanish-
language broadcast television network featuring original telenovelas, theatrical films,
news, specials and sporting events. Telemundo develops original programming primarily through its production studio and also
acquires the rights to content from third parties. We currently hold the Spanish-
language U.S. broadcast rights to FIFA World Cup
soccer from 2015 through 2022 and the Spanish-
language U.S. broadcast rights for the NFL games that the NBC network will
broadcast through the 2022-23 season as part of our agreement with the NFL.
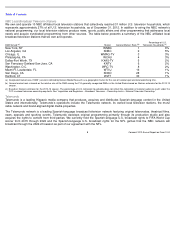
DMA Served
Station
General Market Rank
Percentage of U.S.
Television Households
New York, NY
WNBC
1
6
%
Los Angeles, CA
KNBC
2
5
%
Chicago, IL
WMAQ
-
TV
3
3
%
Philadelphia, PA
WCAU
4
3
%
Dallas-Fort Worth, TX
KXAS-TV
5
2
%
San Francisco-Oakland-San Jose, CA
KNTV
6
2
%
Washington, D.C.
WRC
-
TV
8
2
%
Miami
-
Ft. Lauderdale, FL
WTVJ
16
1
%
San Diego, CA
KNSD
28
1
%
Hartford, CT
WVIT
30
1
%
(a)
Designated market area (“DMA”) served is defined by Nielsen Media Research as a geographic market for the sale of national spot and local advertising time.
(b)
General market rank is based on the relative size of the DMA among the 210 generally recognized DMAs in the United States based on Nielsen estimates for the 2012-
13
season.
(c)
Based on Nielsen estimates for the 2012
-
13 season. The percentage of U.S. television households does not reflect the calculation of national audience reach under the
FCC’s national television ownership cap limits. See “Legislation and Regulation – Broadcast Television – Ownership Limits – National Television Ownership.”
9
Comcast 2012 Annual Report on Form 10-
K
(a) (b) (c)