Comcast 2012 Annual Report Download - page 73
Download and view the complete annual report
Please find page 73 of the 2012 Comcast annual report below. You can navigate through the pages in the report by either clicking on the pages listed below, or by using the keyword search tool below to find specific information within the annual report.-
 1
1 -
 2
2 -
 3
3 -
 4
4 -
 5
5 -
 6
6 -
 7
7 -
 8
8 -
 9
9 -
 10
10 -
 11
11 -
 12
12 -
 13
13 -
 14
14 -
 15
15 -
 16
16 -
 17
17 -
 18
18 -
 19
19 -
 20
20 -
 21
21 -
 22
22 -
 23
23 -
 24
24 -
 25
25 -
 26
26 -
 27
27 -
 28
28 -
 29
29 -
 30
30 -
 31
31 -
 32
32 -
 33
33 -
 34
34 -
 35
35 -
 36
36 -
 37
37 -
 38
38 -
 39
39 -
 40
40 -
 41
41 -
 42
42 -
 43
43 -
 44
44 -
 45
45 -
 46
46 -
 47
47 -
 48
48 -
 49
49 -
 50
50 -
 51
51 -
 52
52 -
 53
53 -
 54
54 -
 55
55 -
 56
56 -
 57
57 -
 58
58 -
 59
59 -
 60
60 -
 61
61 -
 62
62 -
 63
63 -
 64
64 -
 65
65 -
 66
66 -
 67
67 -
 68
68 -
 69
69 -
 70
70 -
 71
71 -
 72
72 -
 73
73 -
 74
74 -
 75
75 -
 76
76 -
 77
77 -
 78
78 -
 79
79 -
 80
80 -
 81
81 -
 82
82 -
 83
83 -
 84
84 -
 85
85 -
 86
86 -
 87
87 -
 88
88 -
 89
89 -
 90
90 -
 91
91 -
 92
92 -
 93
93 -
 94
94 -
 95
95 -
 96
96 -
 97
97 -
 98
98 -
 99
99 -
 100
100 -
 101
101 -
 102
102 -
 103
103 -
 104
104 -
 105
105 -
 106
106 -
 107
107 -
 108
108 -
 109
109 -
 110
110 -
 111
111 -
 112
112 -
 113
113 -
 114
114 -
 115
115 -
 116
116 -
 117
117 -
 118
118 -
 119
119 -
 120
120 -
 121
121 -
 122
122 -
 123
123 -
 124
124 -
 125
125 -
 126
126 -
 127
127 -
 128
128 -
 129
129 -
 130
130 -
 131
131 -
 132
132 -
 133
133 -
 134
134 -
 135
135 -
 136
136 -
 137
137 -
 138
138 -
 139
139 -
 140
140 -
 141
141 -
 142
142 -
 143
143 -
 144
144 -
 145
145 -
 146
146 -
 147
147 -
 148
148 -
 149
149 -
 150
150 -
 151
151 -
 152
152 -
 153
153 -
 154
154 -
 155
155 -
 156
156 -
 157
157 -
 158
158 -
 159
159 -
 160
160 -
 161
161 -
 162
162 -
 163
163 -
 164
164 -
 165
165 -
 166
166 -
 167
167 -
 168
168 -
 169
169 -
 170
170 -
 171
171 -
 172
172 -
 173
173 -
 174
174 -
 175
175 -
 176
176 -
 177
177 -
 178
178 -
 179
179 -
 180
180 -
 181
181 -
 182
182 -
 183
183 -
 184
184 -
 185
185 -
 186
186 -
 187
187 -
 188
188 -
 189
189 -
 190
190 -
 191
191 -
 192
192 -
 193
193 -
 194
194 -
 195
195 -
 196
196 -
 197
197 -
 198
198 -
 199
199 -
 200
200 -
 201
201 -
 202
202 -
 203
203 -
 204
204 -
 205
205 -
 206
206 -
 207
207 -
 208
208 -
 209
209 -
 210
210 -
 211
211 -
 212
212 -
 213
213 -
 214
214 -
 215
215 -
 216
216 -
 217
217 -
 218
218 -
 219
219 -
 220
220 -
 221
221 -
 222
222 -
 223
223 -
 224
224 -
 225
225 -
 226
226 -
 227
227 -
 228
228 -
 229
229 -
 230
230 -
 231
231 -
 232
232 -
 233
233 -
 234
234 -
 235
235 -
 236
236 -
 237
237 -
 238
238 -
 239
239 -
 240
240 -
 241
241 -
 242
242 -
 243
243 -
 244
244 -
 245
245 -
 246
246 -
 247
247 -
 248
248 -
 249
249 -
 250
250 -
 251
251 -
 252
252 -
 253
253 -
 254
254 -
 255
255 -
 256
256 -
 257
257 -
 258
258 -
 259
259 -
 260
260 -
 261
261 -
 262
262 -
 263
263 -
 264
264 -
 265
265 -
 266
266 -
 267
267 -
 268
268 -
 269
269 -
 270
270 -
 271
271 -
 272
272 -
 273
273 -
 274
274 -
 275
275 -
 276
276 -
 277
277 -
 278
278 -
 279
279 -
 280
280 -
 281
281 -
 282
282 -
 283
283 -
 284
284 -
 285
285 -
 286
286 -
 287
287 -
 288
288 -
 289
289 -
 290
290 -
 291
291 -
 292
292 -
 293
293 -
 294
294 -
 295
295 -
 296
296 -
 297
297 -
 298
298 -
 299
299 -
 300
300 -
 301
301
 |
 |

Table of Contents
taxing authority that has full knowledge of all relevant information. A tax position that meets the more-likely-than-
not recognition
threshold is measured to determine the amount of benefit to be recognized in our financial statements. The tax position is measured
at the largest amount of benefit that has a greater than 50% likelihood of being realized when the position is ultimately resolved.
We adjust our estimates periodically to reflect changes in circumstances in ongoing examinations by and settlements with the
various taxing authorities, as well as changes in tax laws, regulations and precedent. We believe that adequate accruals have been
made for income taxes. When uncertain tax positions are ultimately resolved, either individually or in
the aggregate, differences
between our estimated amounts and the actual amounts are not expected to have a material adverse effect on our consolidated
financial position but could possibly be material to our consolidated results of operations or cash flow for any one period. As of
December 31, 2012, our uncertain tax positions and related accrued interest were $1.6 billion and $721 million, respectively.
Item 7A: Quantitative and Qualitative Disclosures About Market Risk
Interest Rate Risk Management
We maintain a mix of fixed-rate and variable-
rate debt and we are exposed to the market risk of adverse changes in interest rates. In
order to manage the cost and volatility relating to the interest cost of our outstanding debt, we enter into various interest rate risk
management derivative transactions in accordance with our policies.
We monitor our exposure to the risk of adverse changes in interest rates through the use of techniques that include market value and
sensitivity analyses. We do not engage in any speculative or leveraged derivative transactions.
Our interest rate derivative financial instruments, which may include swaps, rate locks, caps and collars, represent an integral part of
our interest rate risk management program. Our interest rate derivative financial instruments reduced the portion of our total debt at
fixed rates to 89.5% from 99.9% as of December 31, 2012. In 2012, 2011 and 2010, the effect of our interest rate derivative financial
instruments was a decrease in our interest expense of $106 million, $136 million and $132 million, respectively. Interest rate
derivative financial instruments may have a significant effect on our interest expense in the future.
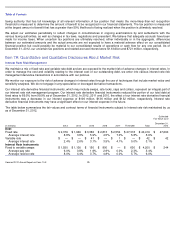
The table below summarizes the fair values and contract terms of financial instruments subject to interest rate risk maintained by us
as of December 31, 2012.
(in millions)
2013
2014
2015
2016
2017
Thereafter
Total
Estimated
Fair Value as of
December 31,
2012
Debt
Fixed rate
$
2,376
$
1,969
$
3,386
$
2,813
$
2,554
$
27,318
$
40,416
$
47,690
Average interest rate
8.8
%
3.8
%
5.9
%
4.5
%
7.0
%
5.8
%
5.9
%
Variable rate
$
—
$
—
$
41
$
—
$
1
$
—
$
42
$
42
Average interest rate
2.4
%
2.6
%
3.1
%
3.5
%
4.1
%
0.0
%
3.1
%
Interest Rate Instruments
Fixed to variable swaps
$
1,550
$
1,100
$
150
$
800
$
—
$
600
$
4,200
$
244
Average pay rate
6.0
%
0.8
%
1.9
%
2.9
%
0.0
%
2.3
%
3.4
%
Average receive rate
8.0
%
4.4
%
3.7
%
4.8
%
0.0
%
5.7
%
6.0
%
Comcast 2012 Annual Report on Form 10-K
70
