Comcast 2012 Annual Report Download - page 103
Download and view the complete annual report
Please find page 103 of the 2012 Comcast annual report below. You can navigate through the pages in the report by either clicking on the pages listed below, or by using the keyword search tool below to find specific information within the annual report.-
 1
1 -
2
-
3
-
4
-
5
-
6
-
7
-
8
-
9
-
10
-
11
-
12
-
13
-
14
-
15
-
16
-
17
-
18
-
19
-
20
-
21
-
22
-
23
-
24
-
25
-
26
-
27
-
28
-
29
-
30
-
31
-
32
-
33
-
34
-
35
-
36
-
37
-
38
-
39
-
40
-
41
-
42
-
43
-
44
-
45
-
46
-
47
-
48
-
49
-
50
-
51
-
52
-
53
-
54
-
55
-
56
-
57
-
58
-
59
-
60
-
61
-
62
-
63
-
64
-
65
-
66
-
67
-
68
-
69
-
70
-
71
-
72
-
73
-
74
-
75
-
76
-
77
-
78
-
79
-
80
-
81
-
82
-
83
-
84
-
85
-
86
-
87
-
88
-
89
-
90
-
91
-
92
-
 93
93 -
 94
94 -
 95
95 -
 96
96 -
 97
97 -
 98
98 -
 99
99 -
 100
100 -
 101
101 -
 102
102 -
 103
103 -
 104
104 -
 105
105 -
 106
106 -
 107
107 -
 108
108 -
 109
109 -
 110
110 -
 111
111 -
 112
112 -
 113
113 -
114
-
115
-
116
-
117
-
118
-
119
-
120
-
121
-
122
-
123
-
124
-
125
-
126
-
127
-
128
-
129
-
130
-
131
-
132
-
133
-
134
-
135
-
136
-
137
-
138
-
139
-
140
-
141
-
142
-
143
-
144
-
145
-
146
-
147
-
148
-
149
-
150
-
151
-
152
-
153
-
154
-
155
-
156
-
157
-
158
-
159
-
160
-
161
-
162
-
163
-
164
-
165
-
166
-
167
-
168
-
169
-
170
-
171
-
172
-
173
-
174
-
175
-
176
-
177
-
178
-
179
-
180
-
181
-
182
-
183
-
184
-
185
-
186
-
187
-
188
-
189
-
190
-
191
-
192
-
193
-
194
-
195
-
196
-
197
-
198
-
199
-
200
-
201
-
202
-
203
-
204
-
205
-
206
-
207
-
208
-
209
-
210
-
211
-
212
-
213
-
214
-
215
-
216
-
217
-
218
-
219
-
220
-
221
-
222
-
223
-
224
-
225
-
226
-
227
-
228
-
229
-
230
-
231
-
232
-
233
-
234
-
235
-
236
-
237
-
238
-
239
-
240
-
241
-
242
-
243
-
244
-
245
-
246
-
247
-
248
-
249
-
250
-
251
-
252
-
253
-
254
-
255
-
256
-
257
-
258
-
259
-
260
-
261
-
262
-
263
-
264
-
265
-
266
-
267
-
268
-
269
-
270
-
271
-
272
-
273
-
274
-
275
-
276
-
277
-
278
-
279
-
280
-
281
-
282
-
283
-
284
-
285
-
286
-
287
-
288
-
289
-
290
-
291
-
292
-
293
-
294
-
295
-
296
-
297
-
298
-
299
-
300
-
301
 |
 |

Table of Contents
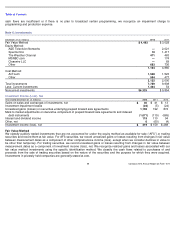
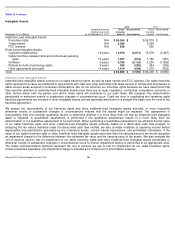
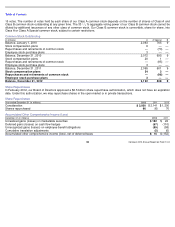
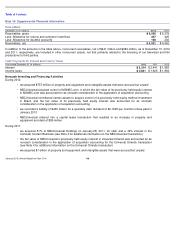
Our assessment of the significance of a particular input to the fair value measurement requires judgment and may affect the
valuation of financial instruments and their classification within the fair value hierarchy. Financial instruments are classified in their
entirety based on the lowest level of input that is significant to the fair value measurement. There have been no changes in the
classification of any financial instruments within the fair value hierarchy in the periods presented. Our financial instruments that are
accounted for at fair value on a recurring basis are presented in the table below.
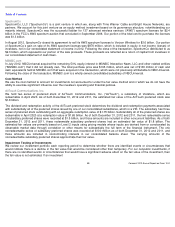
Recurring Fair Value Measures
Contractual Obligations and Contingent Consideration
The fair values of the contractual obligations and contingent consideration in the table above are primarily based on certain expected
future discounted cash flows, the determination of which involves the use of significant unobservable inputs. The most significant
unobservable input we use are our estimates of the future revenue we expect to generate from certain NBCUniversal entities, which
are related to our contractual obligations, and future net tax benefits that will affect payments to GE, which are related to contingent
consideration. The discount rates used in the measurements of fair value were between 6% and 14% and are based on the
underlying risk associated with our estimate of future revenue, as well as the terms of the respective contracts, and the uncertainty in
the timing of our payments to GE. The fair value adjustments to contractual obligations and contingent consideration are sensitive to
the assumptions related to future revenue and tax benefits, respectively, as well as to current interest rates, and therefore, the
adjustments are recorded to other income (expense), net in our consolidated statement of income.
Fair Value as of December 31, 2012
Fair Value as of December 31, 2011
(in millions)
Level 1
Level 2
Level 3
Total
Level 1
Level 2
Level 3
Total
Assets
Trading securities
$
4,027
$
—
$
—
$
4,027
$
2,895
$
—
$
—
$
2,895
Available
-
for
-
sale securities
367
76
21
464
90
20
21
131
Interest rate swap agreements
—
210
—
210
—
246
—
246
Cross-currency swap agreements
—
30
—
30
—
—
—
—
Foreign exchange contracts
—
6
—
6
—
10
—
10
Equity warrants
—
—
2
2
—
—
2
2
Total
$
4,394
$
322
$
23
$
4,739
$
2,985
$
276
$
23
$
3,284
Liabilities
Derivative component of prepaid forward sale
agreements and indexed debt instruments
$
—
$
2,305
$
—
$
2,305
$
—
$
1,234
$
—
$
1,234
Contractual obligations
—
—
1,055
1,055
—
—
1,004
1,004
Contingent consideration
—
—
587
587
—
—
583
583
Foreign exchange contracts
—
14
—
14
—
8
—
8
Cross
-
currency swap agreements
—
—
—
—
—
69
—
69
Total
$
—
$
2,319
$
1,642
$
3,961
$
—
$
1,311
$
1,587
$
2,898
Comcast 2012 Annual Report on Form 10-K
100