Comcast 2012 Annual Report Download - page 57
Download and view the complete annual report
Please find page 57 of the 2012 Comcast annual report below. You can navigate through the pages in the report by either clicking on the pages listed below, or by using the keyword search tool below to find specific information within the annual report.-
 1
1 -
2
-
3
-
4
-
5
-
6
-
7
-
8
-
9
-
10
-
11
-
12
-
13
-
14
-
15
-
16
-
17
-
18
-
19
-
20
-
21
-
22
-
23
-
24
-
25
-
26
-
27
-
28
-
29
-
30
-
31
-
32
-
33
-
34
-
35
-
36
-
37
-
38
-
39
-
40
-
41
-
42
-
43
-
44
-
45
-
46
-
 47
47 -
 48
48 -
 49
49 -
 50
50 -
 51
51 -
 52
52 -
 53
53 -
 54
54 -
 55
55 -
 56
56 -
 57
57 -
 58
58 -
 59
59 -
 60
60 -
 61
61 -
 62
62 -
 63
63 -
 64
64 -
 65
65 -
 66
66 -
 67
67 -
68
-
69
-
70
-
71
-
72
-
73
-
74
-
75
-
76
-
77
-
78
-
79
-
80
-
81
-
82
-
83
-
84
-
85
-
86
-
87
-
88
-
89
-
90
-
91
-
92
-
93
-
94
-
95
-
96
-
97
-
98
-
99
-
100
-
101
-
102
-
103
-
104
-
105
-
106
-
107
-
108
-
109
-
110
-
111
-
112
-
113
-
114
-
115
-
116
-
117
-
118
-
119
-
120
-
121
-
122
-
123
-
124
-
125
-
126
-
127
-
128
-
129
-
130
-
131
-
132
-
133
-
134
-
135
-
136
-
137
-
138
-
139
-
140
-
141
-
142
-
143
-
144
-
145
-
146
-
147
-
148
-
149
-
150
-
151
-
152
-
153
-
154
-
155
-
156
-
157
-
158
-
159
-
160
-
161
-
162
-
163
-
164
-
165
-
166
-
167
-
168
-
169
-
170
-
171
-
172
-
173
-
174
-
175
-
176
-
177
-
178
-
179
-
180
-
181
-
182
-
183
-
184
-
185
-
186
-
187
-
188
-
189
-
190
-
191
-
192
-
193
-
194
-
195
-
196
-
197
-
198
-
199
-
200
-
201
-
202
-
203
-
204
-
205
-
206
-
207
-
208
-
209
-
210
-
211
-
212
-
213
-
214
-
215
-
216
-
217
-
218
-
219
-
220
-
221
-
222
-
223
-
224
-
225
-
226
-
227
-
228
-
229
-
230
-
231
-
232
-
233
-
234
-
235
-
236
-
237
-
238
-
239
-
240
-
241
-
242
-
243
-
244
-
245
-
246
-
247
-
248
-
249
-
250
-
251
-
252
-
253
-
254
-
255
-
256
-
257
-
258
-
259
-
260
-
261
-
262
-
263
-
264
-
265
-
266
-
267
-
268
-
269
-
270
-
271
-
272
-
273
-
274
-
275
-
276
-
277
-
278
-
279
-
280
-
281
-
282
-
283
-
284
-
285
-
286
-
287
-
288
-
289
-
290
-
291
-
292
-
293
-
294
-
295
-
296
-
297
-
298
-
299
-
300
-
301
 |
 |

Table of Contents
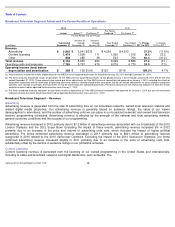
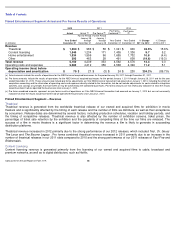
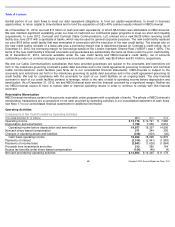
Cable Networks Segment Actual and Pro Forma Results of Operations
Cable Networks Segment – Revenue
Distribution
Distribution revenue is generated from distribution agreements with multichannel video providers and is affected by the number of
subscribers receiving our cable networks and the fees we charge per subscriber.
Distribution revenue increased in 2012 primarily due to contractual rate increases. Pro forma combined distribution revenue
increased in 2011 primarily due to contractual rate increases and increases in the number of subscribers to our cable networks.
businesses and Universal Orlando for the period January 29, 2011 through December 31, 2011. Headquarters, other and eliminations includes the elimination of the results
of operations for Universal Orlando for the period January 29, 2011 through June 30, 2011 in order to reconcile to our consolidated financial statements because Universal
Orlando was recorded as an equity method investment during that period.
(b)
Pro forma amounts include the results of operations for the NBCUniversal acquired businesses and Universal Orlando for the period January 1, 2011 through January 28,
2011 and for the year ended December 31, 2010. These amounts also include pro forma adjustments as if the NBCUniversal and Universal Orlando transactions had
occurred on January 1, 2010, including the effects of acquisition accounting and the elimination of operating costs and expenses directly related to the transactions, but do
not include adjustments for costs related to integration activities, cost savings or synergies that have been or may be achieved by the combined businesses. Pro forma
amounts are not necessarily indicative of what the results would have been had we operated the businesses since January 1, 2010. In 2011 and 2010, total pro forma
adjustments increased operating income before depreciation and amortization by $7 million and $36 million, respectively.
(c)
Pro forma combined amounts represent our pro forma results of operations as if the NBCUniversal and Universal Orlando transactions had occurred on January 1, 2010 but
are not necessarily indicative of what the results would have been had we operated the businesses since January 1, 2010.
2012
2011
2010
Actual
Actual
Pro Forma
Pro Forma
Combined
Actual
Pro Forma
Pro Forma
Combined
(in millions)
Year Ended
December 31
Year Ended
December 31
For the
Period
January 1
through
January 28
Year Ended
December 31
Comcast
Content
Business
NBCUniversal
Businesses
Year Ended
December 31
% Change
2011
to 2012
% Change
2010
to 2011
Revenue
Distribution
$
4,604
$
4,210
$188
$ 4,398
$ 1,599
$ 2,366
$ 3,965
4.7
%
10.9
%
Advertising
3,423
3,189
162
3,351
914
2,170
3,084
2.2
8.7
Content licensing and other
746
709
38
747
206
424
630
(0.2
)
18.7
Total revenue
8,773
8,108
388
8,496
2,719
4,960
7,679
3.3
10.6
Operating costs and expenses
5,481
4,923
236
5,159
1,987
2,526
4,513
6.2
14.3
Operating income before depreciation
and amortization
$
3,292
$
3,185
$152
$3,337
$732
$
2,434
$3,166
(1.3
)%
5.4
%
(a)
Actual amounts include the results of operations for the Comcast Content Business for 2011 and 2010 and the results of operations for the NBCUniversal acquired
businesses for the period January 29, 2011 through December 31, 2011.
(b)
Pro forma amounts include the results of operations for the NBCUniversal acquired businesses for the period January 1, 2011 through January 28, 2011 and for the year
ended December 31, 2010. These amounts also include pro forma adjustments as if the NBCUniversal transaction had occurred on January 1, 2010, including the effects of
acquisition accounting and the elimination of operating costs and expenses directly related to the transaction, but do not include adjustments for costs related to integration
activities, cost savings or synergies that have been or may be achieved by the combined businesses. Pro forma amounts are not necessarily indicative of what the results
would have been had we operated the businesses since January 1, 2010.
(c)
Pro forma combined amounts represent our pro forma results of operations as if the NBCUniversal transaction had occurred on January 1, 2010 but are not necessarily
indicative of what the results would have been had we operated the businesses since January 1, 2010.
Comcast 2012 Annual Report on Form 10
-
K
54
(a)
(b)
(c) (a) (b) (c)