Comcast 2012 Annual Report Download - page 53
Download and view the complete annual report
Please find page 53 of the 2012 Comcast annual report below. You can navigate through the pages in the report by either clicking on the pages listed below, or by using the keyword search tool below to find specific information within the annual report.-
 1
1 -
2
-
3
-
4
-
5
-
6
-
7
-
8
-
9
-
10
-
11
-
12
-
13
-
14
-
15
-
16
-
17
-
18
-
19
-
20
-
21
-
22
-
23
-
24
-
25
-
26
-
27
-
28
-
29
-
30
-
31
-
32
-
33
-
34
-
35
-
36
-
37
-
38
-
39
-
40
-
41
-
42
-
 43
43 -
 44
44 -
 45
45 -
 46
46 -
 47
47 -
 48
48 -
 49
49 -
 50
50 -
 51
51 -
 52
52 -
 53
53 -
 54
54 -
 55
55 -
 56
56 -
 57
57 -
 58
58 -
 59
59 -
 60
60 -
 61
61 -
 62
62 -
 63
63 -
64
-
65
-
66
-
67
-
68
-
69
-
70
-
71
-
72
-
73
-
74
-
75
-
76
-
77
-
78
-
79
-
80
-
81
-
82
-
83
-
84
-
85
-
86
-
87
-
88
-
89
-
90
-
91
-
92
-
93
-
94
-
95
-
96
-
97
-
98
-
99
-
100
-
101
-
102
-
103
-
104
-
105
-
106
-
107
-
108
-
109
-
110
-
111
-
112
-
113
-
114
-
115
-
116
-
117
-
118
-
119
-
120
-
121
-
122
-
123
-
124
-
125
-
126
-
127
-
128
-
129
-
130
-
131
-
132
-
133
-
134
-
135
-
136
-
137
-
138
-
139
-
140
-
141
-
142
-
143
-
144
-
145
-
146
-
147
-
148
-
149
-
150
-
151
-
152
-
153
-
154
-
155
-
156
-
157
-
158
-
159
-
160
-
161
-
162
-
163
-
164
-
165
-
166
-
167
-
168
-
169
-
170
-
171
-
172
-
173
-
174
-
175
-
176
-
177
-
178
-
179
-
180
-
181
-
182
-
183
-
184
-
185
-
186
-
187
-
188
-
189
-
190
-
191
-
192
-
193
-
194
-
195
-
196
-
197
-
198
-
199
-
200
-
201
-
202
-
203
-
204
-
205
-
206
-
207
-
208
-
209
-
210
-
211
-
212
-
213
-
214
-
215
-
216
-
217
-
218
-
219
-
220
-
221
-
222
-
223
-
224
-
225
-
226
-
227
-
228
-
229
-
230
-
231
-
232
-
233
-
234
-
235
-
236
-
237
-
238
-
239
-
240
-
241
-
242
-
243
-
244
-
245
-
246
-
247
-
248
-
249
-
250
-
251
-
252
-
253
-
254
-
255
-
256
-
257
-
258
-
259
-
260
-
261
-
262
-
263
-
264
-
265
-
266
-
267
-
268
-
269
-
270
-
271
-
272
-
273
-
274
-
275
-
276
-
277
-
278
-
279
-
280
-
281
-
282
-
283
-
284
-
285
-
286
-
287
-
288
-
289
-
290
-
291
-
292
-
293
-
294
-
295
-
296
-
297
-
298
-
299
-
300
-
301
 |
 |

Table of Contents
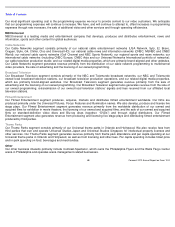
Customer Metrics
Customer data includes residential and business customers.
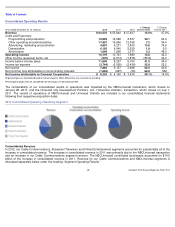
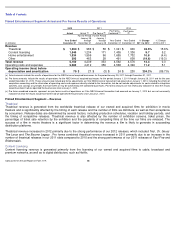
Cable Communications Segment – Revenue
Our average monthly total revenue per video customer increased to $149 in 2012 from $138 in 2011 and $127 in 2010. The
increases in average monthly total revenue per video customer were primarily due to increases in the number of residential
customers receiving multiple services, rate adjustments, higher contributions from business services and declines in the total number
of video customers.
Video
Video revenue increased in 2012 and 2011 primarily due to rate adjustments and additional residential customers receiving higher
levels of video service, which were partially offset by declines in the number of residential video customers in both years. During
2012 and 2011, the number of video customers decreased by 336,000 and 459,000, respectively. These decreases were primarily
due to competitive pressures in our service areas. We may experience further declines in the number of residential video customers.
As of December 31, 2012, 41% of the homes and businesses in the areas we serve subscribed to our video services, compared to
43% and 44% as of December 31, 2011 and 2010, respectively. As of December 31, 2012, 11.5 million customers subscribed to at
least one of our HD video or DVR services, compared to 10.9 million customers and 10.1 million customers as of December 31,
2011 and 2010, respectively.
Year ended December 31 (in millions)
2012
2011
2010
% Change
2011 to 2012
% Change
2010 to 2011
Revenue
Residential:
Video
$
20,112
$
19,625
$
19,363
2.5
%
1.3
%
High
-
speed Internet
9,544
8,743
7,958
9.2
9.9
Voice
3,557
3,503
3,300
1.5
6.2
Business services
2,404
1,791
1,267
34.2
41.4
Advertising
2,287
2,005
2,020
14.1
(0.8
)
Other
1,700
1,559
1,455
9.1
7.2
Total revenue
39,604
37,226
35,363
6.4
5.3
Operating costs and expenses
Programming
8,386
7,851
7,420
6.8
5.8
Technical labor
2,338
2,318
2,300
0.9
0.8
Customer service
1,961
1,882
1,855
4.2
1.5
Marketing
2,707
2,407
2,155
12.5
11.7
Other
7,957
7,480
7,331
6.4
2.0
Total operating costs and expenses
23,349
21,938
21,061
6.4
4.2
Operating income before depreciation and amortization
$
16,255
$
15,288
$
14,302
6.3
%
6.9
%
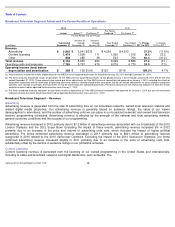
Total Customers
Net Additional Customers
December 31 (in thousands)
2012
2011
2010
2012
2011
2010
Video customers
21,995
22,331
22,790
(336
)
(459
)
(756
)
High
-
speed Internet customers
19,367
18,144
16,985
1,223
1,159
1,058
Voice customers
9,955
9,342
8,610
613
732
988
Comcast 2012 Annual Report on Form 10-K
50