Comcast 2012 Annual Report Download - page 55
Download and view the complete annual report
Please find page 55 of the 2012 Comcast annual report below. You can navigate through the pages in the report by either clicking on the pages listed below, or by using the keyword search tool below to find specific information within the annual report.-
 1
1 -
2
-
3
-
4
-
5
-
6
-
7
-
8
-
9
-
10
-
11
-
12
-
13
-
14
-
15
-
16
-
17
-
18
-
19
-
20
-
21
-
22
-
23
-
24
-
25
-
26
-
27
-
28
-
29
-
30
-
31
-
32
-
33
-
34
-
35
-
36
-
37
-
38
-
39
-
40
-
41
-
42
-
43
-
44
-
 45
45 -
 46
46 -
 47
47 -
 48
48 -
 49
49 -
 50
50 -
 51
51 -
 52
52 -
 53
53 -
 54
54 -
 55
55 -
 56
56 -
 57
57 -
 58
58 -
 59
59 -
 60
60 -
 61
61 -
 62
62 -
 63
63 -
 64
64 -
 65
65 -
66
-
67
-
68
-
69
-
70
-
71
-
72
-
73
-
74
-
75
-
76
-
77
-
78
-
79
-
80
-
81
-
82
-
83
-
84
-
85
-
86
-
87
-
88
-
89
-
90
-
91
-
92
-
93
-
94
-
95
-
96
-
97
-
98
-
99
-
100
-
101
-
102
-
103
-
104
-
105
-
106
-
107
-
108
-
109
-
110
-
111
-
112
-
113
-
114
-
115
-
116
-
117
-
118
-
119
-
120
-
121
-
122
-
123
-
124
-
125
-
126
-
127
-
128
-
129
-
130
-
131
-
132
-
133
-
134
-
135
-
136
-
137
-
138
-
139
-
140
-
141
-
142
-
143
-
144
-
145
-
146
-
147
-
148
-
149
-
150
-
151
-
152
-
153
-
154
-
155
-
156
-
157
-
158
-
159
-
160
-
161
-
162
-
163
-
164
-
165
-
166
-
167
-
168
-
169
-
170
-
171
-
172
-
173
-
174
-
175
-
176
-
177
-
178
-
179
-
180
-
181
-
182
-
183
-
184
-
185
-
186
-
187
-
188
-
189
-
190
-
191
-
192
-
193
-
194
-
195
-
196
-
197
-
198
-
199
-
200
-
201
-
202
-
203
-
204
-
205
-
206
-
207
-
208
-
209
-
210
-
211
-
212
-
213
-
214
-
215
-
216
-
217
-
218
-
219
-
220
-
221
-
222
-
223
-
224
-
225
-
226
-
227
-
228
-
229
-
230
-
231
-
232
-
233
-
234
-
235
-
236
-
237
-
238
-
239
-
240
-
241
-
242
-
243
-
244
-
245
-
246
-
247
-
248
-
249
-
250
-
251
-
252
-
253
-
254
-
255
-
256
-
257
-
258
-
259
-
260
-
261
-
262
-
263
-
264
-
265
-
266
-
267
-
268
-
269
-
270
-
271
-
272
-
273
-
274
-
275
-
276
-
277
-
278
-
279
-
280
-
281
-
282
-
283
-
284
-
285
-
286
-
287
-
288
-
289
-
290
-
291
-
292
-
293
-
294
-
295
-
296
-
297
-
298
-
299
-
300
-
301
 |
 |

Table of Contents
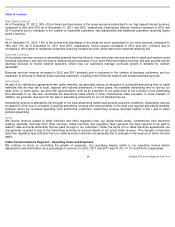
Programming Expenses
Programming expenses, our largest operating expense, are the fees we pay to license the programming we distribute to our video
customers. These expenses are affected by the programming license fees charged by cable networks and fees for retransmission of
local broadcast television stations’
signals and by the number of video customers we serve and the amount of content we provide.
Programming expenses increased in 2012 and 2011 primarily due to increases in programming license fees and fees incurred to
secure rights for additional programming for our customers.
We anticipate that our programming expenses will continue to increase as we provide additional content to our video customers,
including in HD and On Demand; as we deliver this content through an increasing number of platforms, such as online and through
our mobile apps for smartphones and tablets; and as the fees charged to us increase. Programming expenses will also increase to
the extent we improve the rate in which the number of our residential video customers decrease. We believe that adding more
content and delivering it on various platforms will assist in attracting and retaining video customers.
Technical Labor Expenses
Technical labor expenses include the internal and external labor costs to complete service call and installation activities, as well as
network operations, fulfillment and provisioning costs. These expenses remained relatively flat in 2012 and 2011 primarily due to an
increase in customer self-installation activities.
Customer Service Expenses
Customer service expenses include the personnel and other costs associated with handling customer sales and service activity.
Customer service expenses increased in 2012 primarily due to increases in labor costs associated with higher levels of customer
service activity. Customer service expenses remained relatively flat in 2011.
Marketing Expenses
Marketing expenses increased in 2012 and 2011 primarily due to increases in spending associated with the continued expansion of
business services to medium-
sized businesses and costs associated with branding and competitive marketing, as well as increases
in direct sales efforts.
Other Costs and Expenses
Other operating costs and expenses include franchise fees, pole rentals, plant maintenance, vehicle-
related costs, advertising and
representation fees, and expenses associated with business services. These expenses increased in 2012 primarily due to increases
in activity related to business services, advertising and network operations, and increases in franchise and other regulatory fees.
These expenses increased in 2011 primarily due to the continued expansion of business services and other service enhancement
initiatives.
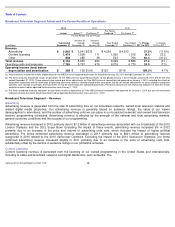
NBCUniversal Segments Overview
The discussion below compares the NBCUniversal segments’
actual results for 2012 to the pro forma combined results for 2011 and
2010. Management believes reviewing our operating results by combining actual and pro forma results for the NBCUniversal
segments for 2011 and 2010 is more useful in identifying trends in, or reaching conclusions regarding, the overall operating
performance of these segments in 2012. The pro forma amounts presented in the tables below include adjustments as if the
NBCUniversal and Universal Orlando transactions had each occurred on January 1, 2010. The pro forma data was also adjusted for
the effects of acquisition accounting and the elimination of costs and expenses directly related to the transactions but does not
include adjustments for costs related to integration activities, cost savings or synergies that have been or may be achieved by the
combined businesses. Pro forma amounts are not necessarily
Comcast 2012 Annual Report on Form 10-K
52