Comcast 2012 Annual Report Download - page 95
Download and view the complete annual report
Please find page 95 of the 2012 Comcast annual report below. You can navigate through the pages in the report by either clicking on the pages listed below, or by using the keyword search tool below to find specific information within the annual report.-
 1
1 -
2
-
3
-
4
-
5
-
6
-
7
-
8
-
9
-
10
-
11
-
12
-
13
-
14
-
15
-
16
-
17
-
18
-
19
-
20
-
21
-
22
-
23
-
24
-
25
-
26
-
27
-
28
-
29
-
30
-
31
-
32
-
33
-
34
-
35
-
36
-
37
-
38
-
39
-
40
-
41
-
42
-
43
-
44
-
45
-
46
-
47
-
48
-
49
-
50
-
51
-
52
-
53
-
54
-
55
-
56
-
57
-
58
-
59
-
60
-
61
-
62
-
63
-
64
-
65
-
66
-
67
-
68
-
69
-
70
-
71
-
72
-
73
-
74
-
75
-
76
-
77
-
78
-
79
-
80
-
81
-
82
-
83
-
84
-
 85
85 -
 86
86 -
 87
87 -
 88
88 -
 89
89 -
 90
90 -
 91
91 -
 92
92 -
 93
93 -
 94
94 -
 95
95 -
 96
96 -
 97
97 -
 98
98 -
 99
99 -
 100
100 -
 101
101 -
 102
102 -
 103
103 -
 104
104 -
 105
105 -
106
-
107
-
108
-
109
-
110
-
111
-
112
-
113
-
114
-
115
-
116
-
117
-
118
-
119
-
120
-
121
-
122
-
123
-
124
-
125
-
126
-
127
-
128
-
129
-
130
-
131
-
132
-
133
-
134
-
135
-
136
-
137
-
138
-
139
-
140
-
141
-
142
-
143
-
144
-
145
-
146
-
147
-
148
-
149
-
150
-
151
-
152
-
153
-
154
-
155
-
156
-
157
-
158
-
159
-
160
-
161
-
162
-
163
-
164
-
165
-
166
-
167
-
168
-
169
-
170
-
171
-
172
-
173
-
174
-
175
-
176
-
177
-
178
-
179
-
180
-
181
-
182
-
183
-
184
-
185
-
186
-
187
-
188
-
189
-
190
-
191
-
192
-
193
-
194
-
195
-
196
-
197
-
198
-
199
-
200
-
201
-
202
-
203
-
204
-
205
-
206
-
207
-
208
-
209
-
210
-
211
-
212
-
213
-
214
-
215
-
216
-
217
-
218
-
219
-
220
-
221
-
222
-
223
-
224
-
225
-
226
-
227
-
228
-
229
-
230
-
231
-
232
-
233
-
234
-
235
-
236
-
237
-
238
-
239
-
240
-
241
-
242
-
243
-
244
-
245
-
246
-
247
-
248
-
249
-
250
-
251
-
252
-
253
-
254
-
255
-
256
-
257
-
258
-
259
-
260
-
261
-
262
-
263
-
264
-
265
-
266
-
267
-
268
-
269
-
270
-
271
-
272
-
273
-
274
-
275
-
276
-
277
-
278
-
279
-
280
-
281
-
282
-
283
-
284
-
285
-
286
-
287
-
288
-
289
-
290
-
291
-
292
-
293
-
294
-
295
-
296
-
297
-
298
-
299
-
300
-
301
 |
 |

Table of Contents
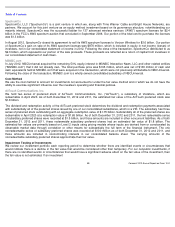
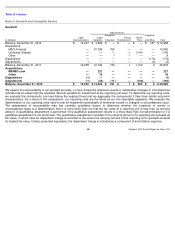
As of December 31, 2012, substantially all of our fair value method investments were equity securities which were held as collateral
related to our obligations under prepaid forward sale agreements.
Prepaid Forward Sale Agreements
The obligations related to these investments terminate between 2013 and 2015. At termination, the counterparties are entitled to
receive some or all of the equity securities, or an equivalent amount of cash at our option, based on the market value of the equity
securities at that time. As of December 31, 2012 and 2011, our prepaid forward sale obligations had an estimated fair value of $3.6
billion and $2.5 billion, respectively.
The derivative component of the prepaid forward sale agreements are equity derivative financial instruments embedded in the
related contracts, which we use to manage our exposure to and benefits from price fluctuations in the common stock of the related
investments. For these derivative financial instruments we separate the derivative component from the host contract and changes in
its value are recorded each period to investment income (loss), net.
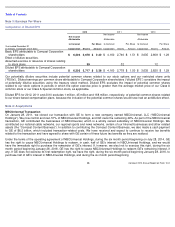
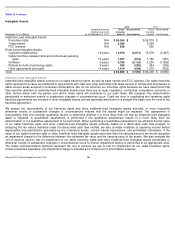
Clearwire LLC
In September 2012, we exchanged our ownership units in Clearwire Communications LLC (“Clearwire LLC”)
and our voting Class B
stock of Clearwire Corporation (“Clearwire”)
for 89 million Class A shares of Clearwire. Following this exchange, we now account for
our investment in Clearwire as an available-for-
sale security under the fair value method. As of December 31, 2012, the fair value of
our investment in Clearwire was $256 million.
Equity Method
We use the equity method to account for investments in which we have the ability to exercise significant influence over the investee’
s
operating and financial policies. Equity method investments are recorded at cost and are adjusted to recognize (i) our proportionate
share of the investee’
s net income or losses after the date of investment, (ii) amortization of the recorded investment that exceeds
our share of the book value of the investee’
s net assets, (iii) additional contributions made and dividends received and
(iv) impairments resulting from other-than-
temporary declines in fair value. For some investments, we record our share of the
investee’
s net income or loss one quarter in arrears due to the timing of our receipt of such information. Gains or losses on the sale
of equity method investments are recorded to other income (expense), net. If an equity method investee were to issue additional
securities that would change our proportionate share of the entity, we would recognize the change, if any, as a gain or loss in our
consolidated statement of income.
A&E Television Networks
In August 2012, NBCUniversal closed its redemption agreement with A&E Television Networks LLC (“A&E Television Networks”
)
whereby A&E Television Networks redeemed NBCUniversal
’
s 15.8% equity interest in A&E Television Networks for $3 billion in
cash. NBCUniversal recognized a pretax gain of $1 billion, which is included in other income (expense), net in our consolidated
statement of income in 2012. In 2012, we recorded net income attributable to noncontrolling interests of $495 million and
consolidated income tax expense of $196 million related to this transaction.
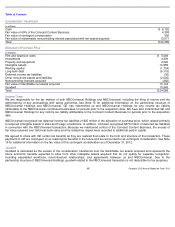
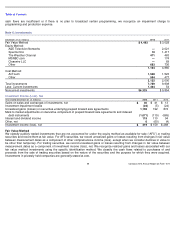
December 31 (in millions)
2012
2011
Assets:
Fair value equity securities held
$
4,143
$
2,984
Liabilities:
Obligations under prepaid forward sale agreements
$
1,248
$
1,177
Derivative component of prepaid forward sale agreements
2,302
1,228
Total liabilities
$
3,550
$
2,405
Comcast 2012 Annual Report on Form 10-K
92