Comcast 2012 Annual Report Download - page 91
Download and view the complete annual report
Please find page 91 of the 2012 Comcast annual report below. You can navigate through the pages in the report by either clicking on the pages listed below, or by using the keyword search tool below to find specific information within the annual report.-
 1
1 -
2
-
3
-
4
-
5
-
6
-
7
-
8
-
9
-
10
-
11
-
12
-
13
-
14
-
15
-
16
-
17
-
18
-
19
-
20
-
21
-
22
-
23
-
24
-
25
-
26
-
27
-
28
-
29
-
30
-
31
-
32
-
33
-
34
-
35
-
36
-
37
-
38
-
39
-
40
-
41
-
42
-
43
-
44
-
45
-
46
-
47
-
48
-
49
-
50
-
51
-
52
-
53
-
54
-
55
-
56
-
57
-
58
-
59
-
60
-
61
-
62
-
63
-
64
-
65
-
66
-
67
-
68
-
69
-
70
-
71
-
72
-
73
-
74
-
75
-
76
-
77
-
78
-
79
-
80
-
 81
81 -
 82
82 -
 83
83 -
 84
84 -
 85
85 -
 86
86 -
 87
87 -
 88
88 -
 89
89 -
 90
90 -
 91
91 -
 92
92 -
 93
93 -
 94
94 -
 95
95 -
 96
96 -
 97
97 -
 98
98 -
 99
99 -
 100
100 -
 101
101 -
102
-
103
-
104
-
105
-
106
-
107
-
108
-
109
-
110
-
111
-
112
-
113
-
114
-
115
-
116
-
117
-
118
-
119
-
120
-
121
-
122
-
123
-
124
-
125
-
126
-
127
-
128
-
129
-
130
-
131
-
132
-
133
-
134
-
135
-
136
-
137
-
138
-
139
-
140
-
141
-
142
-
143
-
144
-
145
-
146
-
147
-
148
-
149
-
150
-
151
-
152
-
153
-
154
-
155
-
156
-
157
-
158
-
159
-
160
-
161
-
162
-
163
-
164
-
165
-
166
-
167
-
168
-
169
-
170
-
171
-
172
-
173
-
174
-
175
-
176
-
177
-
178
-
179
-
180
-
181
-
182
-
183
-
184
-
185
-
186
-
187
-
188
-
189
-
190
-
191
-
192
-
193
-
194
-
195
-
196
-
197
-
198
-
199
-
200
-
201
-
202
-
203
-
204
-
205
-
206
-
207
-
208
-
209
-
210
-
211
-
212
-
213
-
214
-
215
-
216
-
217
-
218
-
219
-
220
-
221
-
222
-
223
-
224
-
225
-
226
-
227
-
228
-
229
-
230
-
231
-
232
-
233
-
234
-
235
-
236
-
237
-
238
-
239
-
240
-
241
-
242
-
243
-
244
-
245
-
246
-
247
-
248
-
249
-
250
-
251
-
252
-
253
-
254
-
255
-
256
-
257
-
258
-
259
-
260
-
261
-
262
-
263
-
264
-
265
-
266
-
267
-
268
-
269
-
270
-
271
-
272
-
273
-
274
-
275
-
276
-
277
-
278
-
279
-
280
-
281
-
282
-
283
-
284
-
285
-
286
-
287
-
288
-
289
-
290
-
291
-
292
-
293
-
294
-
295
-
296
-
297
-
298
-
299
-
300
-
301
 |
 |

Table of Contents
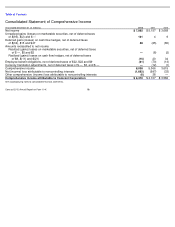
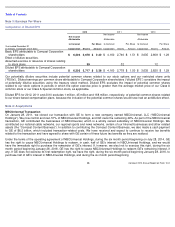
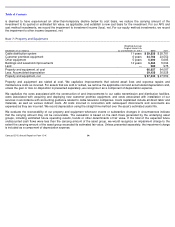
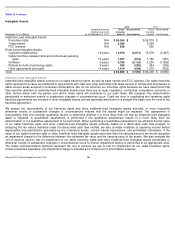
Transaction-Related Expenses
We incurred the following expenses in 2011 and 2010 that resulted either directly from the NBCUniversal transaction or from shared
costs associated with NBCUniversal’s debt issuances prior to the close of the NBCUniversal transaction.
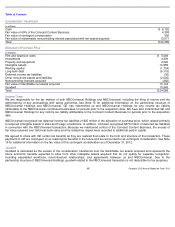
Universal Orlando Transaction
On July 1, 2011, NBCUniversal acquired the remaining 50% equity interest in Universal Orlando that it did not already own for $1
billion. Following the close of the transaction, Universal Orlando is a wholly owned consolidated subsidiary of NBCUniversal, and its
operations are reported in our Theme Parks segment.
Allocation of Purchase Price
We applied acquisition accounting to the businesses of Universal Orlando, and its results of operations are included in our
consolidated results of operations following the acquisition date.
The carrying value of our investment in Universal Orlando on July 1, 2011 was $1 billion, which approximated its fair value and,
therefore, no gain or loss was recognized as a result of the acquisition.
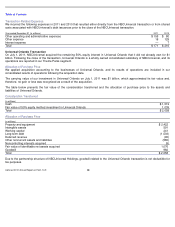
The table below presents the fair value of the consideration transferred and the allocation of purchase price to the assets and
liabilities of Universal Orlando.
Consideration Transferred
Allocation of Purchase Price
Due to the partnership structure of NBCUniversal Holdings, goodwill related to the Universal Orlando transaction is not deductible for
tax purposes.
Year ended December 31 (in millions)
2011
2010
Other operating and administrative expenses
$
155
$
80
Other expense
16
129
Interest expense
—
7
Total
$
171
$
216
(in millions)
Cash
$
1,019
Fair value of 50% equity method investment in Universal Orlando
1,039
Total
$
2,058
(in millions)
Property and equipment
$
2,422
Intangible assets
591
Working capital
241
Long
-
term debt
(1,503
)
Deferred revenue
(90
)
Other noncurrent assets and liabilities
(580
)
Noncontrolling interests acquired
(5
)
Fair value of identifiable net assets acquired
1,076
Goodwill
982
Total
$
2,058
Comcast 2012 Annual Report on Form 10-K
88