Comcast 2012 Annual Report Download - page 56
Download and view the complete annual report
Please find page 56 of the 2012 Comcast annual report below. You can navigate through the pages in the report by either clicking on the pages listed below, or by using the keyword search tool below to find specific information within the annual report.-
 1
1 -
2
-
3
-
4
-
5
-
6
-
7
-
8
-
9
-
10
-
11
-
12
-
13
-
14
-
15
-
16
-
17
-
18
-
19
-
20
-
21
-
22
-
23
-
24
-
25
-
26
-
27
-
28
-
29
-
30
-
31
-
32
-
33
-
34
-
35
-
36
-
37
-
38
-
39
-
40
-
41
-
42
-
43
-
44
-
45
-
 46
46 -
 47
47 -
 48
48 -
 49
49 -
 50
50 -
 51
51 -
 52
52 -
 53
53 -
 54
54 -
 55
55 -
 56
56 -
 57
57 -
 58
58 -
 59
59 -
 60
60 -
 61
61 -
 62
62 -
 63
63 -
 64
64 -
 65
65 -
 66
66 -
67
-
68
-
69
-
70
-
71
-
72
-
73
-
74
-
75
-
76
-
77
-
78
-
79
-
80
-
81
-
82
-
83
-
84
-
85
-
86
-
87
-
88
-
89
-
90
-
91
-
92
-
93
-
94
-
95
-
96
-
97
-
98
-
99
-
100
-
101
-
102
-
103
-
104
-
105
-
106
-
107
-
108
-
109
-
110
-
111
-
112
-
113
-
114
-
115
-
116
-
117
-
118
-
119
-
120
-
121
-
122
-
123
-
124
-
125
-
126
-
127
-
128
-
129
-
130
-
131
-
132
-
133
-
134
-
135
-
136
-
137
-
138
-
139
-
140
-
141
-
142
-
143
-
144
-
145
-
146
-
147
-
148
-
149
-
150
-
151
-
152
-
153
-
154
-
155
-
156
-
157
-
158
-
159
-
160
-
161
-
162
-
163
-
164
-
165
-
166
-
167
-
168
-
169
-
170
-
171
-
172
-
173
-
174
-
175
-
176
-
177
-
178
-
179
-
180
-
181
-
182
-
183
-
184
-
185
-
186
-
187
-
188
-
189
-
190
-
191
-
192
-
193
-
194
-
195
-
196
-
197
-
198
-
199
-
200
-
201
-
202
-
203
-
204
-
205
-
206
-
207
-
208
-
209
-
210
-
211
-
212
-
213
-
214
-
215
-
216
-
217
-
218
-
219
-
220
-
221
-
222
-
223
-
224
-
225
-
226
-
227
-
228
-
229
-
230
-
231
-
232
-
233
-
234
-
235
-
236
-
237
-
238
-
239
-
240
-
241
-
242
-
243
-
244
-
245
-
246
-
247
-
248
-
249
-
250
-
251
-
252
-
253
-
254
-
255
-
256
-
257
-
258
-
259
-
260
-
261
-
262
-
263
-
264
-
265
-
266
-
267
-
268
-
269
-
270
-
271
-
272
-
273
-
274
-
275
-
276
-
277
-
278
-
279
-
280
-
281
-
282
-
283
-
284
-
285
-
286
-
287
-
288
-
289
-
290
-
291
-
292
-
293
-
294
-
295
-
296
-
297
-
298
-
299
-
300
-
301
 |
 |

Table of Contents
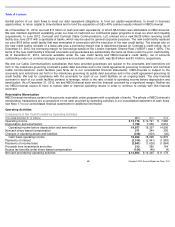
indicative of what our results would have been had we operated the NBCUniversal contributed businesses or Universal Orlando
since January 1, 2010, nor of our future results.
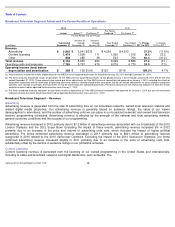
2012 NBCUniversal Segments Operating Results
The operating results of the NBCUniversal segments for 2012, 2011 and 2010 are presented in the table below.
2012
2011
2010
Actual
Actual
Pro Forma
Pro Forma
Combined
Actual
Pro Forma
Pro Forma
Combined
(in millions)
Year Ended
December 31
Year Ended
December 31
NBCUniversal
Businesses
Year Ended
December 31
Comcast
Content
Business
NBCUniversal
Businesses
Year Ended
December 31
% Change
2011
to 2012
% Change
2010
to 2011
Revenue
Cable Networks
$
8,773
$
8,108
$
388
$
8,496
$
2,719
$
4,960
$
7,679
3.3
%
10.6
%
Broadcast Television
8,154
5,935
464
6,399
—
6,888
6,888
27.4
(7.1
)
Filmed Entertainment
5,159
4,239
353
4,592
—
4,576
4,576
12.4
0.3
Theme Parks
2,085
1,874
115
1,989
—
1,600
1,600
4.8
24.3
Headquarters, other and eliminations
(359
)
(896
)
544
(352
)
—
(
369
)
(369
)
(2.1
)
4.8
Total revenue
$
23,812
$
19,260
$
1,864
$
21,124
$
2,719
$
17,655
$
20,374
12.7
%
3.7
%
Operating Income Before Depreciation
and Amortization
Cable Networks
$
3,292
$
3,185
$
152
$
3,337
$
732
$
2,434
$
3,166
(1.3
)%
5.4
%
Broadcast Television
369
138
(15
)
123
—
118
118
199.2
4.7
Filmed Entertainment
79
27
(3
)
24
—
230
230
234.2
(89.7
)
Theme Parks
953
830
37
867
—
591
591
9.9
46.6
Headquarters, other and eliminations
(586
)
(718
)
136
(582
)
—
(
421
)
(421
)
(0.6
)
(38.1
)
Total operating income before
depreciation and amortization
$
4,107
$
3,462
$
307
$
3,769
$
732
$
2,952
$
3,684
9.0
%
2.3
%
(a)
Actual amounts for our reportable segments include the results of operations for the businesses we contributed as part of the NBCUniversal transaction (
“
Comcast Content
Business”) for 2011 and 2010, and the results of operations for the NBCUniversal acquired
53
Comcast 2012 Annual Report on Form 10-
K
(a) (b) (c)
(a)
(b) (c)