Comcast 2012 Annual Report Download - page 69
Download and view the complete annual report
Please find page 69 of the 2012 Comcast annual report below. You can navigate through the pages in the report by either clicking on the pages listed below, or by using the keyword search tool below to find specific information within the annual report.-
 1
1 -
2
-
3
-
4
-
5
-
6
-
7
-
8
-
9
-
10
-
11
-
12
-
13
-
14
-
15
-
16
-
17
-
18
-
19
-
20
-
21
-
22
-
23
-
24
-
25
-
26
-
27
-
28
-
29
-
30
-
31
-
32
-
33
-
34
-
35
-
36
-
37
-
38
-
39
-
40
-
41
-
42
-
43
-
44
-
45
-
46
-
47
-
48
-
49
-
50
-
51
-
52
-
53
-
54
-
55
-
56
-
57
-
58
-
 59
59 -
 60
60 -
 61
61 -
 62
62 -
 63
63 -
 64
64 -
 65
65 -
 66
66 -
 67
67 -
 68
68 -
 69
69 -
 70
70 -
 71
71 -
 72
72 -
 73
73 -
 74
74 -
 75
75 -
 76
76 -
 77
77 -
 78
78 -
 79
79 -
80
-
81
-
82
-
83
-
84
-
85
-
86
-
87
-
88
-
89
-
90
-
91
-
92
-
93
-
94
-
95
-
96
-
97
-
98
-
99
-
100
-
101
-
102
-
103
-
104
-
105
-
106
-
107
-
108
-
109
-
110
-
111
-
112
-
113
-
114
-
115
-
116
-
117
-
118
-
119
-
120
-
121
-
122
-
123
-
124
-
125
-
126
-
127
-
128
-
129
-
130
-
131
-
132
-
133
-
134
-
135
-
136
-
137
-
138
-
139
-
140
-
141
-
142
-
143
-
144
-
145
-
146
-
147
-
148
-
149
-
150
-
151
-
152
-
153
-
154
-
155
-
156
-
157
-
158
-
159
-
160
-
161
-
162
-
163
-
164
-
165
-
166
-
167
-
168
-
169
-
170
-
171
-
172
-
173
-
174
-
175
-
176
-
177
-
178
-
179
-
180
-
181
-
182
-
183
-
184
-
185
-
186
-
187
-
188
-
189
-
190
-
191
-
192
-
193
-
194
-
195
-
196
-
197
-
198
-
199
-
200
-
201
-
202
-
203
-
204
-
205
-
206
-
207
-
208
-
209
-
210
-
211
-
212
-
213
-
214
-
215
-
216
-
217
-
218
-
219
-
220
-
221
-
222
-
223
-
224
-
225
-
226
-
227
-
228
-
229
-
230
-
231
-
232
-
233
-
234
-
235
-
236
-
237
-
238
-
239
-
240
-
241
-
242
-
243
-
244
-
245
-
246
-
247
-
248
-
249
-
250
-
251
-
252
-
253
-
254
-
255
-
256
-
257
-
258
-
259
-
260
-
261
-
262
-
263
-
264
-
265
-
266
-
267
-
268
-
269
-
270
-
271
-
272
-
273
-
274
-
275
-
276
-
277
-
278
-
279
-
280
-
281
-
282
-
283
-
284
-
285
-
286
-
287
-
288
-
289
-
290
-
291
-
292
-
293
-
294
-
295
-
296
-
297
-
298
-
299
-
300
-
301
 |
 |
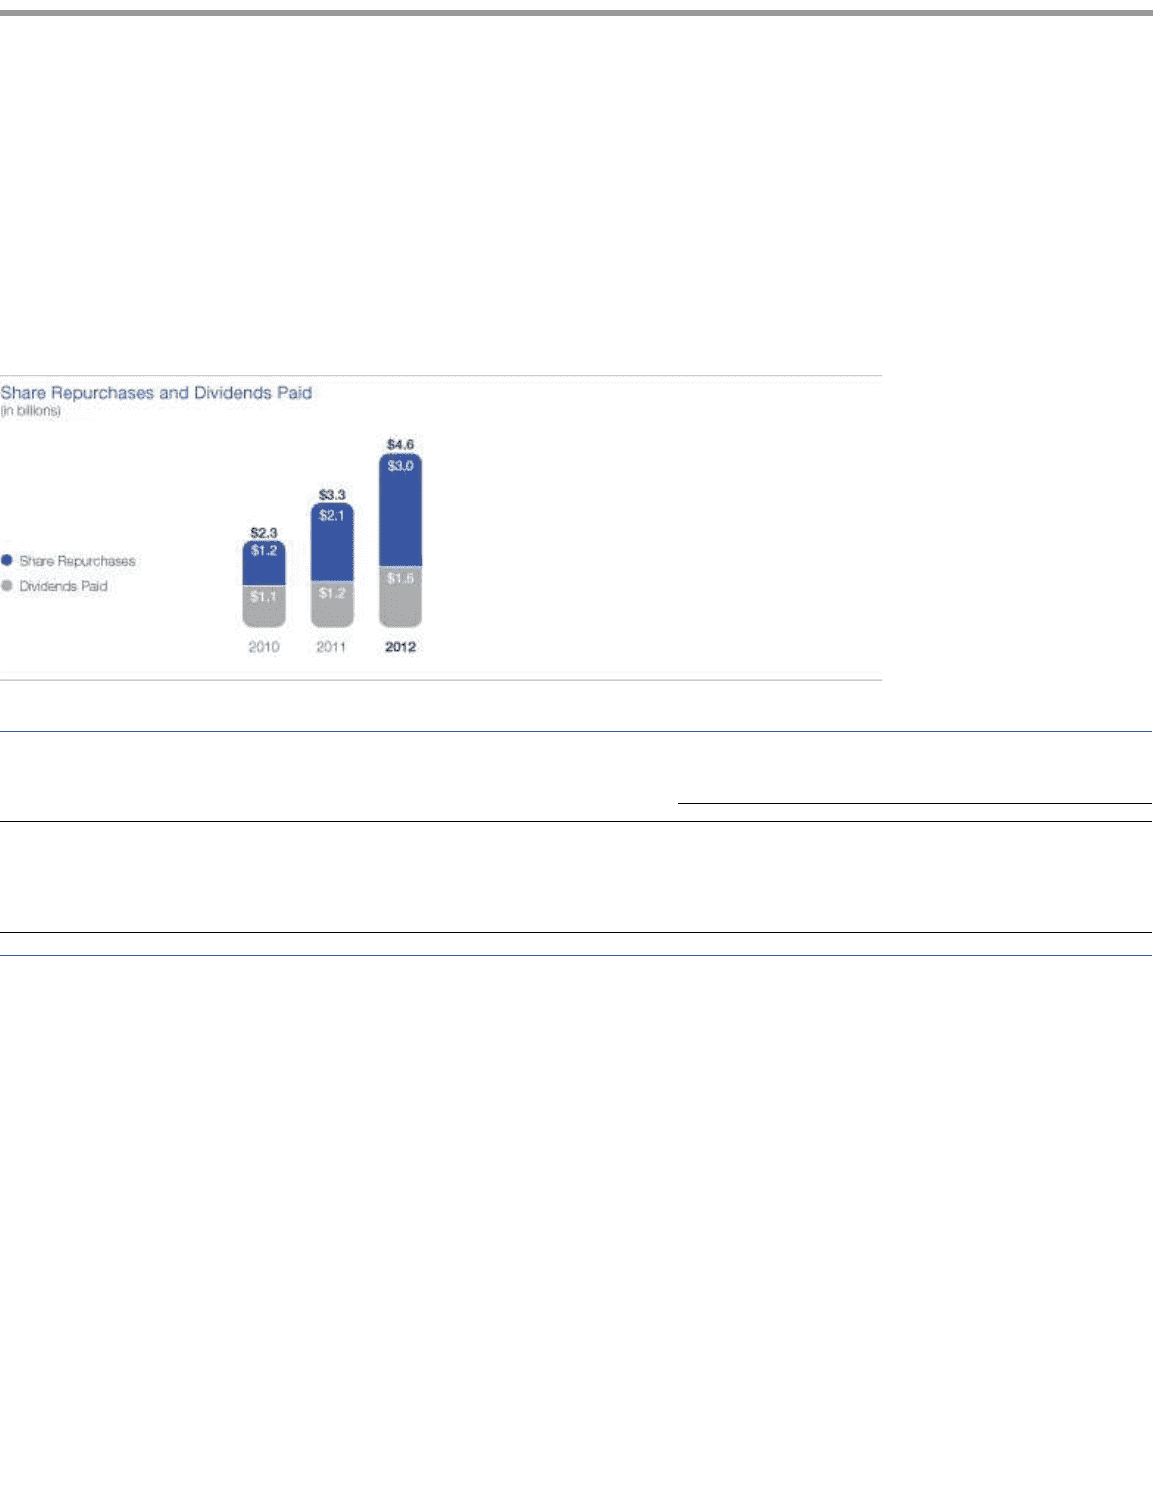
Table of Contents
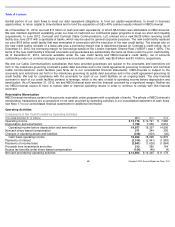
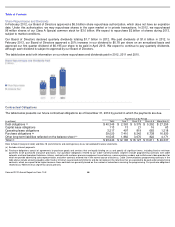
Share Repurchases and Dividends
In February 2012, our Board of Directors approved a $6.5 billion share repurchase authorization, which does not have an expiration
date. Under this authorization, we may repurchase shares in the open market or in private transactions. In 2012, we repurchased
96 million shares of our Class A Special common stock for $3.0 billion. We expect to repurchase $2 billion of shares during 2013,
subject to market conditions.
Our Board of Directors declared quarterly dividends totaling $1.7 billion in 2012. We paid dividends of $1.6 billion in 2012. In
February 2013, our Board of Directors approved a 20% increase in our dividend to $0.78 per share on an annualized basis and
approved our first quarter dividend of $0.195 per share to be paid in April 2013. We expect to continue to pay quarterly dividends,
although each dividend is subject to approval by our Board of Directors.
The table below sets forth information on our share repurchases and dividends paid in 2012, 2011 and 2010.
Contractual Obligations
The table below presents our future contractual obligations as of December 31, 2012 by period in which the payments are due.
Refer to Note 9 (long-term debt) and Note 18 (commitments and contingencies) to our consolidated financial statements.
Payment Due by Period
(in millions)
Total
Year 1
Years 2-
3
Years 4-
5
More than 5
Debt obligations
$
40,345
$
2,363
$
5,375
$
5,352
$
27,255
Capital lease obligations
113
13
21
16
63
Operating lease obligations
3,217
497
819
683
1,218
Purchase obligations
39,020
7,410
8,242
6,738
16,630
Other long
-
term liabilities reflected on the balance sheet
10,545
1,882
3,670
822
4,171
Total
$
93,240
$
12,165
$
18,127
$
13,611
$
49,337
(a)
Excludes interest payments.
(b)
Purchase obligations consist of agreements to purchase goods and services that are legally binding on us and specify all significant terms, including fixed or minimum
quantities to be purchased and price provisions. Our purchase obligations related to our Cable Communications segment include programming contracts with cable
networks and local broadcast television stations, contracts with customer premises equipment manufacturers, communication vendors and multichannel video providers for
which we provide advertising sales representation, and other contracts entered into in the normal course of business. Cable Communications programming contracts in the
table above include amounts payable under fixed or minimum guaranteed commitments and do not represent the total fees that are expected to be paid under programming
contracts, which we expect to be higher because these contracts are generally based on the number of subscribers receiving the programming. Our purchase obligations
related to our NBCUniversal segments consist primarily
Comcast 2012 Annual Report on Form 10
-
K
66
(a)
(b)
(c)
(d)