Comcast 2012 Annual Report Download - page 119
Download and view the complete annual report
Please find page 119 of the 2012 Comcast annual report below. You can navigate through the pages in the report by either clicking on the pages listed below, or by using the keyword search tool below to find specific information within the annual report.-
 1
1 -
2
-
3
-
4
-
5
-
6
-
7
-
8
-
9
-
10
-
11
-
12
-
13
-
14
-
15
-
16
-
17
-
18
-
19
-
20
-
21
-
22
-
23
-
24
-
25
-
26
-
27
-
28
-
29
-
30
-
31
-
32
-
33
-
34
-
35
-
36
-
37
-
38
-
39
-
40
-
41
-
42
-
43
-
44
-
45
-
46
-
47
-
48
-
49
-
50
-
51
-
52
-
53
-
54
-
55
-
56
-
57
-
58
-
59
-
60
-
61
-
62
-
63
-
64
-
65
-
66
-
67
-
68
-
69
-
70
-
71
-
72
-
73
-
74
-
75
-
76
-
77
-
78
-
79
-
80
-
81
-
82
-
83
-
84
-
85
-
86
-
87
-
88
-
89
-
90
-
91
-
92
-
93
-
94
-
95
-
96
-
97
-
98
-
99
-
100
-
101
-
102
-
103
-
104
-
105
-
106
-
107
-
108
-
 109
109 -
 110
110 -
 111
111 -
 112
112 -
 113
113 -
 114
114 -
 115
115 -
 116
116 -
 117
117 -
 118
118 -
 119
119 -
 120
120 -
 121
121 -
 122
122 -
 123
123 -
 124
124 -
 125
125 -
 126
126 -
 127
127 -
 128
128 -
 129
129 -
130
-
131
-
132
-
133
-
134
-
135
-
136
-
137
-
138
-
139
-
140
-
141
-
142
-
143
-
144
-
145
-
146
-
147
-
148
-
149
-
150
-
151
-
152
-
153
-
154
-
155
-
156
-
157
-
158
-
159
-
160
-
161
-
162
-
163
-
164
-
165
-
166
-
167
-
168
-
169
-
170
-
171
-
172
-
173
-
174
-
175
-
176
-
177
-
178
-
179
-
180
-
181
-
182
-
183
-
184
-
185
-
186
-
187
-
188
-
189
-
190
-
191
-
192
-
193
-
194
-
195
-
196
-
197
-
198
-
199
-
200
-
201
-
202
-
203
-
204
-
205
-
206
-
207
-
208
-
209
-
210
-
211
-
212
-
213
-
214
-
215
-
216
-
217
-
218
-
219
-
220
-
221
-
222
-
223
-
224
-
225
-
226
-
227
-
228
-
229
-
230
-
231
-
232
-
233
-
234
-
235
-
236
-
237
-
238
-
239
-
240
-
241
-
242
-
243
-
244
-
245
-
246
-
247
-
248
-
249
-
250
-
251
-
252
-
253
-
254
-
255
-
256
-
257
-
258
-
259
-
260
-
261
-
262
-
263
-
264
-
265
-
266
-
267
-
268
-
269
-
270
-
271
-
272
-
273
-
274
-
275
-
276
-
277
-
278
-
279
-
280
-
281
-
282
-
283
-
284
-
285
-
286
-
287
-
288
-
289
-
290
-
291
-
292
-
293
-
294
-
295
-
296
-
297
-
298
-
299
-
300
-
301
 |
 |

Table of Contents
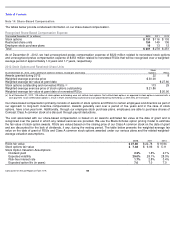
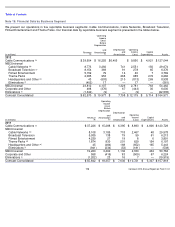
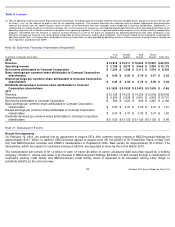
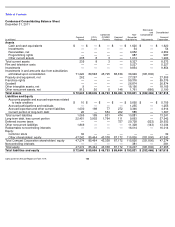
For the years ended December 31, 2012, 2011 and 2010, Cable Communications segment revenue was derived from the following sources:
(in millions)
Revenue
Operating
Income
(Loss)
Before
Depreciation
and
Amortization
Depreciation
and
Amortization
Operating
Income
(Loss)
Capital
Expenditures
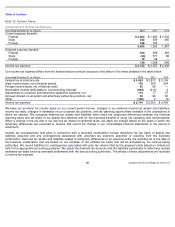
2010
Cable Communications
$
35,363
$
14,302
$
6,232
$
8,070
$
4,853
Cable Networks
2,719
732
323
409
52
Corporate and Other
168
(438
)
61
(499
)
56
Eliminations
(313
)
—
—
—
—
Comcast Consolidated
$
37,937
$
14,596
$
6,616
$
7,980
$
4,961
(a)
Our Cable Communications segment consists primarily of our cable services business and the businesses of Comcast Interactive Media that were not contributed to
NBCUniversal.
2012
2011
2010
Residential:
Video
50.8
%
52.7
%
54.8
%
High-speed Internet
24.1
%
23.5
%
22.5
%
Voice
9.0
%
9.4
%
9.3
%
Business services
6.1
%
4.8
%
3.6
%
Advertising
5.8
%
5.4
%
5.7
%
Other
4.2
%
4.2
%
4.1
%
Total
100
%
100
%
100
%
Subscription revenue received from customers who purchase bundled services at a discounted rate is allocated proportionally to each service based on the individual
service’s price on a stand-alone basis. For each of 2012, 2011 and 2010, 2.8% of Cable Communications revenue was derived from franchise and other regulatory fees.
(b)
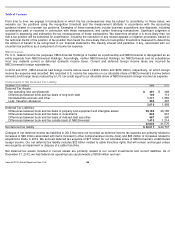
Our Cable Networks segment included the results of operations of the businesses we contributed to NBCUniversal, as well as the results of operations of the NBCUniversal
contributed cable networks for 2012 and for the period January 29, 2011 through December 31, 2011. For 2010, our Cable Networks segment consisted of the Comcast
Content Business.
(c)
For 2012, our Broadcast Television segment included all revenue and costs and expenses associated with our broadcast of the 2012 London Olympics, which generated
$120 million of operating income before depreciation and amortization. This amount reflects the settlement of a $237 million liability associated with the unfavorable
Olympics contract that had been recorded through the application of acquisition accounting in 2011.
(d)
For the period January 29, 2011 through June 30, 2011, we recorded Universal Orlando as an equity method investment in our consolidated results of operations. However,
our Theme Parks segment included the results of operations for Universal Orlando for the period January 29, 2011 through June 30, 2011 to reflect our measure of
operating performance for our Theme Parks segment.
(e)
NBCUniversal Headquarters and Other activities included costs associated with overhead, allocations, personnel costs and headquarter initiatives.
(f)
Eliminations are transactions that our segments enter into with one another. The most common types of transactions are the following:
•
our Cable Networks and Broadcast Television segments generate revenue by selling programming to our Cable Communications segment,
which represents a substantial majority of the revenue elimination amount
•
our Cable Communications segment generates revenue by selling advertising and by selling the use of satellite feeds to our Cable Networks
segment
•
our Filmed Entertainment and Broadcast Television segments generate revenue by licensing content to our Cable Networks segment
•
our Cable
Communications segment receives incentives offered by our Cable Networks segment in connection with its distribution of the
Cable Networks’ content that are recorded as a reduction to programming expenses
NBCUniversal eliminations for 2011 included the eliminations of the results of operations for Universal Orlando for the period January 29, 2011 through June 30, 2011.
These amounts were not included in NBCUniversal’
s total and our consolidated results of operations for the period January 29, 2011 through June 30, 2011 because we
recorded Universal Orlando as an equity method investment during this period.
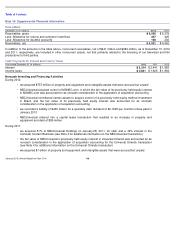
(g)
Revenue from customers located outside of the U.S., primarily in Europe and Asia, for the years ended December 31, 2012 and 2011 was $4.5 billion and $4.1 billion,
respectively. Revenue from customers located outside of the U.S. was not significant for the year ended December 31, 2010. No single customer accounted for a significant
amount of our revenue in any period.
Comcast 2012 Annual Report on Form 10
-
K
116
(g)
(h)
(a)
(b)
(f)