Comcast 2012 Annual Report Download - page 118
Download and view the complete annual report
Please find page 118 of the 2012 Comcast annual report below. You can navigate through the pages in the report by either clicking on the pages listed below, or by using the keyword search tool below to find specific information within the annual report.-
 1
1 -
2
-
3
-
4
-
5
-
6
-
7
-
8
-
9
-
10
-
11
-
12
-
13
-
14
-
15
-
16
-
17
-
18
-
19
-
20
-
21
-
22
-
23
-
24
-
25
-
26
-
27
-
28
-
29
-
30
-
31
-
32
-
33
-
34
-
35
-
36
-
37
-
38
-
39
-
40
-
41
-
42
-
43
-
44
-
45
-
46
-
47
-
48
-
49
-
50
-
51
-
52
-
53
-
54
-
55
-
56
-
57
-
58
-
59
-
60
-
61
-
62
-
63
-
64
-
65
-
66
-
67
-
68
-
69
-
70
-
71
-
72
-
73
-
74
-
75
-
76
-
77
-
78
-
79
-
80
-
81
-
82
-
83
-
84
-
85
-
86
-
87
-
88
-
89
-
90
-
91
-
92
-
93
-
94
-
95
-
96
-
97
-
98
-
99
-
100
-
101
-
102
-
103
-
104
-
105
-
106
-
107
-
 108
108 -
 109
109 -
 110
110 -
 111
111 -
 112
112 -
 113
113 -
 114
114 -
 115
115 -
 116
116 -
 117
117 -
 118
118 -
 119
119 -
 120
120 -
 121
121 -
 122
122 -
 123
123 -
 124
124 -
 125
125 -
 126
126 -
 127
127 -
 128
128 -
129
-
130
-
131
-
132
-
133
-
134
-
135
-
136
-
137
-
138
-
139
-
140
-
141
-
142
-
143
-
144
-
145
-
146
-
147
-
148
-
149
-
150
-
151
-
152
-
153
-
154
-
155
-
156
-
157
-
158
-
159
-
160
-
161
-
162
-
163
-
164
-
165
-
166
-
167
-
168
-
169
-
170
-
171
-
172
-
173
-
174
-
175
-
176
-
177
-
178
-
179
-
180
-
181
-
182
-
183
-
184
-
185
-
186
-
187
-
188
-
189
-
190
-
191
-
192
-
193
-
194
-
195
-
196
-
197
-
198
-
199
-
200
-
201
-
202
-
203
-
204
-
205
-
206
-
207
-
208
-
209
-
210
-
211
-
212
-
213
-
214
-
215
-
216
-
217
-
218
-
219
-
220
-
221
-
222
-
223
-
224
-
225
-
226
-
227
-
228
-
229
-
230
-
231
-
232
-
233
-
234
-
235
-
236
-
237
-
238
-
239
-
240
-
241
-
242
-
243
-
244
-
245
-
246
-
247
-
248
-
249
-
250
-
251
-
252
-
253
-
254
-
255
-
256
-
257
-
258
-
259
-
260
-
261
-
262
-
263
-
264
-
265
-
266
-
267
-
268
-
269
-
270
-
271
-
272
-
273
-
274
-
275
-
276
-
277
-
278
-
279
-
280
-
281
-
282
-
283
-
284
-
285
-
286
-
287
-
288
-
289
-
290
-
291
-
292
-
293
-
294
-
295
-
296
-
297
-
298
-
299
-
300
-
301
 |
 |

Table of Contents
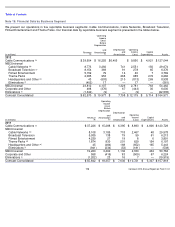
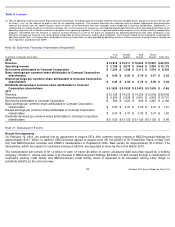
Note 19: Financial Data by Business Segment
We present our operations in five reportable business segments: Cable Communications, Cable Networks, Broadcast Television,
Filmed Entertainment and Theme Parks. Our financial data by reportable business segment is presented in the tables below.
(in millions)
Revenue
Operating
Income
(Loss)
Before
Depreciation
and
Amortization
Depreciation
and
Amortization
Operating
Income
(Loss)
Capital
Expenditures
Assets
2012
Cable Communications
$
39,604
$
16,255
$6,405
$
9,850
$
4,921
$
127,044
NBCUniversal
Cable Networks
8,773
3,292
741
2,551
150
29,674
Broadcast Television
8,154
369
91
278
65
6,376
Filmed Entertainment
5,159
79
16
63
7
3,769
Theme Parks
2,085
953
268
685
272
6,266
Headquarters and Other
43
(603
)
210
(813
)
269
8,938
Eliminations
(402
)
17
—
17
—
(
561
)
NBCUniversal
23,812
4,107
1,326
2,781
763
54,462
Corporate and Other
498
(376
)
67
(443
)
30
6,000
Eliminations
(1,344
)
(9
)
—
(
9
)
—
(
22,535
)
Comcast Consolidated
$
62,570
$
19,977
$
7,798
$
12,179
$
5,714
$
164,971
(in millions)
Revenue
Operating
Income
(Loss)
Before
Depreciation
and
Amortization
Depreciation
and
Amortization
Operating
Income
(Loss)
Capital
Expenditures
Assets
2011
Cable Communications
$
37,226
$
15,288
$
6,395
$
8,893
$
4,806
$
120,729
NBCUniversal
Cable Networks
8,108
3,185
718
2,467
48
29,578
Broadcast Television
5,935
138
79
59
61
6,213
Filmed Entertainment
4,239
27
19
8
6
3,891
Theme Parks
1,874
830
201
629
154
6,197
Headquarters and Other
45
(484
)
168
(652
)
165
5,443
Eliminations
(941
)
(234
)
(53
)
(181
)
—
(
538
)
NBCUniversal
19,260
3,462
1,132
2,330
434
50,784
Corporate and Other
558
(416
)
93
(509
)
67
6,224
Eliminations
(1,202
)
23
16
7
—
(
19,919
)
Comcast Consolidated
$
55,842
$
18,357
$
7,636
$
10,721
$
5,307
$
157,818
115
Comcast 2012 Annual Report on Form 10
-
K
(g) (h)
(a)
(b)
(c)
(e)
(f)
(f)
(g)
(h)
(a)
(b)
(d)
(e)
(f)
(f)