Comcast 2012 Annual Report Download - page 100
Download and view the complete annual report
Please find page 100 of the 2012 Comcast annual report below. You can navigate through the pages in the report by either clicking on the pages listed below, or by using the keyword search tool below to find specific information within the annual report.-
 1
1 -
2
-
3
-
4
-
5
-
6
-
7
-
8
-
9
-
10
-
11
-
12
-
13
-
14
-
15
-
16
-
17
-
18
-
19
-
20
-
21
-
22
-
23
-
24
-
25
-
26
-
27
-
28
-
29
-
30
-
31
-
32
-
33
-
34
-
35
-
36
-
37
-
38
-
39
-
40
-
41
-
42
-
43
-
44
-
45
-
46
-
47
-
48
-
49
-
50
-
51
-
52
-
53
-
54
-
55
-
56
-
57
-
58
-
59
-
60
-
61
-
62
-
63
-
64
-
65
-
66
-
67
-
68
-
69
-
70
-
71
-
72
-
73
-
74
-
75
-
76
-
77
-
78
-
79
-
80
-
81
-
82
-
83
-
84
-
85
-
86
-
87
-
88
-
89
-
 90
90 -
 91
91 -
 92
92 -
 93
93 -
 94
94 -
 95
95 -
 96
96 -
 97
97 -
 98
98 -
 99
99 -
 100
100 -
 101
101 -
 102
102 -
 103
103 -
 104
104 -
 105
105 -
 106
106 -
 107
107 -
 108
108 -
 109
109 -
 110
110 -
111
-
112
-
113
-
114
-
115
-
116
-
117
-
118
-
119
-
120
-
121
-
122
-
123
-
124
-
125
-
126
-
127
-
128
-
129
-
130
-
131
-
132
-
133
-
134
-
135
-
136
-
137
-
138
-
139
-
140
-
141
-
142
-
143
-
144
-
145
-
146
-
147
-
148
-
149
-
150
-
151
-
152
-
153
-
154
-
155
-
156
-
157
-
158
-
159
-
160
-
161
-
162
-
163
-
164
-
165
-
166
-
167
-
168
-
169
-
170
-
171
-
172
-
173
-
174
-
175
-
176
-
177
-
178
-
179
-
180
-
181
-
182
-
183
-
184
-
185
-
186
-
187
-
188
-
189
-
190
-
191
-
192
-
193
-
194
-
195
-
196
-
197
-
198
-
199
-
200
-
201
-
202
-
203
-
204
-
205
-
206
-
207
-
208
-
209
-
210
-
211
-
212
-
213
-
214
-
215
-
216
-
217
-
218
-
219
-
220
-
221
-
222
-
223
-
224
-
225
-
226
-
227
-
228
-
229
-
230
-
231
-
232
-
233
-
234
-
235
-
236
-
237
-
238
-
239
-
240
-
241
-
242
-
243
-
244
-
245
-
246
-
247
-
248
-
249
-
250
-
251
-
252
-
253
-
254
-
255
-
256
-
257
-
258
-
259
-
260
-
261
-
262
-
263
-
264
-
265
-
266
-
267
-
268
-
269
-
270
-
271
-
272
-
273
-
274
-
275
-
276
-
277
-
278
-
279
-
280
-
281
-
282
-
283
-
284
-
285
-
286
-
287
-
288
-
289
-
290
-
291
-
292
-
293
-
294
-
295
-
296
-
297
-
298
-
299
-
300
-
301
 |
 |

Table of Contents
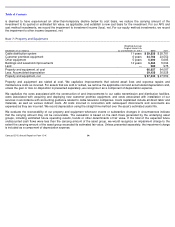
Finite-Lived Intangible Assets
Estimated Amortization Expense of Finite-Lived Intangibles
Finite-
lived intangible assets subject to amortization consist primarily of customer relationships acquired in business combinations,
cable franchise renewal costs, contractual operating rights, intellectual property rights and software. Our finite-
lived intangible assets
are amortized primarily on a straight-line basis over their estimated useful life or the term of the respective agreement.
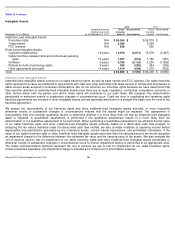
We capitalize direct development costs associated with internal-
use software, including external direct costs of material and services
and payroll costs for employees devoting time to these software projects. We also capitalize costs associated with the purchase of
software licenses. We include these costs in other intangible assets and amortize them on a straight-
line basis over a period not to
exceed 5 years, beginning when the asset is substantially ready for use. We expense maintenance and training costs, as well as
costs incurred during the preliminary stage of a project, as they are incurred. We capitalize initial operating system software costs
and amortize them over the life of the associated hardware.
We evaluate the recoverability of our intangible assets subject to amortization whenever events or substantive changes in
circumstances indicate that the carrying amount may not be recoverable. The evaluation is based on the cash flows generated by
the underlying asset groups, including estimated future operating results, trends or other determinants of fair value. If the total of the
expected future undiscounted cash flows were less than the carrying amount of the asset group, we would recognize an impairment
charge to the extent the carrying amount of the asset group exceeds its estimated fair value. Unless presented separately, the
impairment charge is included as a component of amortization expense.
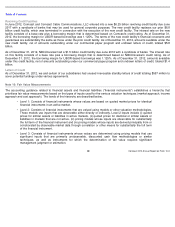
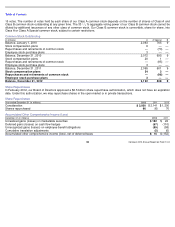
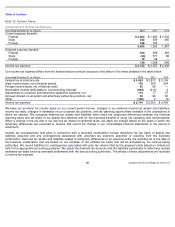
Note 9: Long-Term Debt
Long-Term Debt Outstanding
(in millions)
2013
$
1,463
2014
$
1,285
2015
$
1,139
2016
$
995
2017
$
848
December 31 (in millions)
Weighted-
Average
Interest Rate as of
December 31,
2012
2012
2011
Commercial paper
N/A
$
—
$
550
Senior notes with maturities of 5 years or less
5.858
%
12,991
11,347
Senior notes with maturities between 6 and 10 years
5.379
%
10,334
10,689
Senior notes with maturities greater than 10 years
6.007
%
16,801
16,115
Other, including capital lease obligations
—
332
608
Total debt
5.60
%
40,458
39,309
Less: Current portion
2,376
1,367
Long-term debt
$
38,082
$
37,942
(a)
For both the December 31, 2012 and 2011 amounts include £625 million of 5.50% notes due 2029 translated at $1 billion, using the exchange rates as of these dates.
97
Comcast 2012 Annual Report on Form 10
-
K
(c)
(a)
(b)