Comcast 2012 Annual Report Download - page 66
Download and view the complete annual report
Please find page 66 of the 2012 Comcast annual report below. You can navigate through the pages in the report by either clicking on the pages listed below, or by using the keyword search tool below to find specific information within the annual report.
Table of Contents
stantial portion of our cash flows to meet our debt repayment obligations, to fund our capital expenditures, to invest in business
opportunities, to return capital to shareholders and to fund the acquisition of GE’s 49% common equity interest in NBCUniversal.
As of December 31, 2012, we held $11 billion of cash and cash equivalents, of which $5.9 billion was attributable to NBCUniversal.
We also maintain significant availability under our lines of credit and our commercial paper programs to meet our short-
term liquidity
requirements. In June 2012, Comcast and Comcast Cable Communications, LLC entered into a new $6.25 billion revolving credit
facility due June 2017 with a syndicate of banks, which may be used for general corporate purposes. The new credit facility replaced
our prior $6.8 billion credit facility that was terminated in connection with the execution of the new credit facility. The interest rate on
the new credit facility consists of a base rate plus a borrowing margin that is determined based on Comcast’
s credit rating. As of
December 31, 2012, the borrowing margin for borrowings based on the London Interbank Offered Rate (“LIBOR”)
was 1.125%. The
terms of the new credit facility’
s financial covenants and guarantees are substantially the same as those under the prior credit facility.
As of December 31, 2012, amounts available under the new credit facility and NBCUniversal
’
s credit facility, net of amounts
outstanding under our commercial paper programs and undrawn letters of credit, was $5.8 billion and $1.4 billion, respectively.
We and our Cable Communications subsidiaries that have provided guarantees are subject to the covenants and restrictions set
forth in the indentures governing Comcast’s public debt securities and in the credit agreements governing Comcast’
s and Comcast
Cable Communications’
credit facilities (see Note 22 to our consolidated financial statements). NBCUniversal is subject to the
covenants and restrictions set forth in the indentures governing its public debt securities and in the credit agreement governing its
credit facility. We test for compliance with the covenants for each of our credit facilities on an ongoing basis. The only financial
covenant in each of our credit facilities pertains to leverage, which is the ratio of debt to operating income before depreciation and
amortization. As of December 31, 2012, we and NBCUniversal each met this financial covenant by a significant margin. Neither we
nor NBCUniversal expect to have to reduce debt or improve operating results in order to continue to comply with this financial
covenant.
Receivables Monetization
NBCUniversal monetizes certain of its accounts receivable under programs with a syndicate of banks. The effects of NBCUniversal’
s
monetization transactions are a component of net cash provided by operating activities in our consolidated statement of cash flows.
See Note 17 to our consolidated financial statements for additional information.
Operating Activities
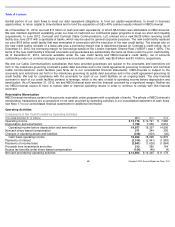
Components of Net Cash Provided by Operating Activities
Year ended December 31 (in millions)
2012
2011
2010
Operating income
$
12,179
$
10,721
$
7,980
Depreciation and amortization
7,798
7,636
6,616
Operating income before depreciation and amortization
19,977
18,357
14,596
Noncash share-based compensation
371
344
300
Changes in operating assets and liabilities
(418
)
(603
)
(20
)
Cash basis operating income
19,930
18,098
14,876
Payments of interest
(2,314
)
(2,441
)
(1,983
)
Payments of income taxes
(2,841
)
(1,626
)
(1,864
)
Proceeds from investments and other
213
360
154
Excess tax benefits under share
-
based compensation
(134
)
(46
)
(4
)
Net cash provided by operating activities
$
14,854
$
14,345
$
11,179
63
Comcast 2012 Annual Report on Form 10-
K


