Comcast 2012 Annual Report Download - page 101
Download and view the complete annual report
Please find page 101 of the 2012 Comcast annual report below. You can navigate through the pages in the report by either clicking on the pages listed below, or by using the keyword search tool below to find specific information within the annual report.-
 1
1 -
2
-
3
-
4
-
5
-
6
-
7
-
8
-
9
-
10
-
11
-
12
-
13
-
14
-
15
-
16
-
17
-
18
-
19
-
20
-
21
-
22
-
23
-
24
-
25
-
26
-
27
-
28
-
29
-
30
-
31
-
32
-
33
-
34
-
35
-
36
-
37
-
38
-
39
-
40
-
41
-
42
-
43
-
44
-
45
-
46
-
47
-
48
-
49
-
50
-
51
-
52
-
53
-
54
-
55
-
56
-
57
-
58
-
59
-
60
-
61
-
62
-
63
-
64
-
65
-
66
-
67
-
68
-
69
-
70
-
71
-
72
-
73
-
74
-
75
-
76
-
77
-
78
-
79
-
80
-
81
-
82
-
83
-
84
-
85
-
86
-
87
-
88
-
89
-
90
-
 91
91 -
 92
92 -
 93
93 -
 94
94 -
 95
95 -
 96
96 -
 97
97 -
 98
98 -
 99
99 -
 100
100 -
 101
101 -
 102
102 -
 103
103 -
 104
104 -
 105
105 -
 106
106 -
 107
107 -
 108
108 -
 109
109 -
 110
110 -
 111
111 -
112
-
113
-
114
-
115
-
116
-
117
-
118
-
119
-
120
-
121
-
122
-
123
-
124
-
125
-
126
-
127
-
128
-
129
-
130
-
131
-
132
-
133
-
134
-
135
-
136
-
137
-
138
-
139
-
140
-
141
-
142
-
143
-
144
-
145
-
146
-
147
-
148
-
149
-
150
-
151
-
152
-
153
-
154
-
155
-
156
-
157
-
158
-
159
-
160
-
161
-
162
-
163
-
164
-
165
-
166
-
167
-
168
-
169
-
170
-
171
-
172
-
173
-
174
-
175
-
176
-
177
-
178
-
179
-
180
-
181
-
182
-
183
-
184
-
185
-
186
-
187
-
188
-
189
-
190
-
191
-
192
-
193
-
194
-
195
-
196
-
197
-
198
-
199
-
200
-
201
-
202
-
203
-
204
-
205
-
206
-
207
-
208
-
209
-
210
-
211
-
212
-
213
-
214
-
215
-
216
-
217
-
218
-
219
-
220
-
221
-
222
-
223
-
224
-
225
-
226
-
227
-
228
-
229
-
230
-
231
-
232
-
233
-
234
-
235
-
236
-
237
-
238
-
239
-
240
-
241
-
242
-
243
-
244
-
245
-
246
-
247
-
248
-
249
-
250
-
251
-
252
-
253
-
254
-
255
-
256
-
257
-
258
-
259
-
260
-
261
-
262
-
263
-
264
-
265
-
266
-
267
-
268
-
269
-
270
-
271
-
272
-
273
-
274
-
275
-
276
-
277
-
278
-
279
-
280
-
281
-
282
-
283
-
284
-
285
-
286
-
287
-
288
-
289
-
290
-
291
-
292
-
293
-
294
-
295
-
296
-
297
-
298
-
299
-
300
-
301
 |
 |

Table of Contents
As of December 31, 2012 and 2011, our debt had an estimated fair value of $47.7 billion and $45.1 billion, respectively. The
estimated fair value of our publicly traded debt is based on quoted market values for the debt. To estimate the fair value of debt for
which there are no quoted market prices, we use interest rates available to us for debt with similar terms and remaining maturities.
Some of our loan agreements require that we maintain certain financial ratios based on our debt and our operating income before
depreciation and amortization. We were in compliance with all financial covenants for all periods presented. See Note 22 for
additional information on our subsidiary guarantee structures.
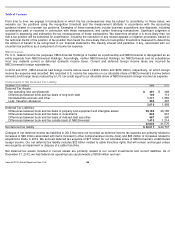
2012 Debt Borrowings
In January 2013, we issued $750 million aggregate principal amount of 2.850% senior notes due 2023, $1.7 billion aggregate
principal amount of 4.250% senior notes due 2033 and $500 million aggregate principal amount of 4.500% senior notes due 2043.
2012 Debt Repayments and Redemptions
Debt Instruments
Commercial Paper Programs
Our commercial paper programs provide a lower cost source of borrowing to fund our short-
term working capital requirements and
are supported by our revolving credit facilities. As of December 31, 2012, the borrowing capacity available under these programs
totaled $2.25 billion for Comcast and $1.5 billion for NBCUniversal.
(b)
Includes the effects of our derivative financial instruments.
(c)
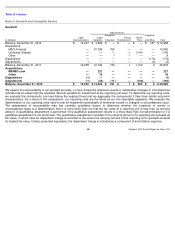
The senior notes with maturities of 5 years or less as of December 31, 2012 were as follows:
(in millions)
Weighted-
Average
Interest Rate
2013
8.081
%
$
2,346
2014
3.698
%
$
1,945
2015
5.882
%
$
3,363
2016
4.474
%
$
2,791
2017
6.944
%
$
2,546
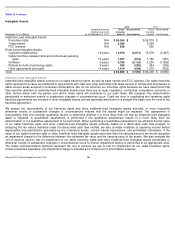
Year ended December 31, 2012 (in millions)
Comcast 4.650% senior notes due 2042
$
1,250
Comcast 3.125% senior notes due 2022
1,000
NBCUniversal 2.875% senior notes due 2023
1,000
NBCUniversal 4.450% senior notes due 2043
1,000
Comcast 5% senior notes due 2061
288
Other
6
Total
$
4,544
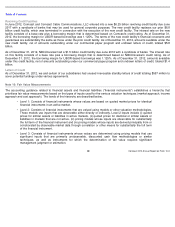
Year ended December 31, 2012 (in millions)
Comcast 7% senior notes due 2055
$
1,125
Comcast 6.625% senior notes due 2056
575
Comcast 9.8% senior notes due 2012
553
Universal Orlando 8.875% senior notes due 2015
260
Comcast 10.625% senior subordinated debentures due 2012
202
Universal Orlando 10.875% senior subordinated notes due 2016
146
Other
20
Total
$
2,881
Comcast 2012 Annual Report on Form 10-K
98