Comcast 2012 Annual Report Download - page 92
Download and view the complete annual report
Please find page 92 of the 2012 Comcast annual report below. You can navigate through the pages in the report by either clicking on the pages listed below, or by using the keyword search tool below to find specific information within the annual report.-
 1
1 -
2
-
3
-
4
-
5
-
6
-
7
-
8
-
9
-
10
-
11
-
12
-
13
-
14
-
15
-
16
-
17
-
18
-
19
-
20
-
21
-
22
-
23
-
24
-
25
-
26
-
27
-
28
-
29
-
30
-
31
-
32
-
33
-
34
-
35
-
36
-
37
-
38
-
39
-
40
-
41
-
42
-
43
-
44
-
45
-
46
-
47
-
48
-
49
-
50
-
51
-
52
-
53
-
54
-
55
-
56
-
57
-
58
-
59
-
60
-
61
-
62
-
63
-
64
-
65
-
66
-
67
-
68
-
69
-
70
-
71
-
72
-
73
-
74
-
75
-
76
-
77
-
78
-
79
-
80
-
81
-
 82
82 -
 83
83 -
 84
84 -
 85
85 -
 86
86 -
 87
87 -
 88
88 -
 89
89 -
 90
90 -
 91
91 -
 92
92 -
 93
93 -
 94
94 -
 95
95 -
 96
96 -
 97
97 -
 98
98 -
 99
99 -
 100
100 -
 101
101 -
 102
102 -
103
-
104
-
105
-
106
-
107
-
108
-
109
-
110
-
111
-
112
-
113
-
114
-
115
-
116
-
117
-
118
-
119
-
120
-
121
-
122
-
123
-
124
-
125
-
126
-
127
-
128
-
129
-
130
-
131
-
132
-
133
-
134
-
135
-
136
-
137
-
138
-
139
-
140
-
141
-
142
-
143
-
144
-
145
-
146
-
147
-
148
-
149
-
150
-
151
-
152
-
153
-
154
-
155
-
156
-
157
-
158
-
159
-
160
-
161
-
162
-
163
-
164
-
165
-
166
-
167
-
168
-
169
-
170
-
171
-
172
-
173
-
174
-
175
-
176
-
177
-
178
-
179
-
180
-
181
-
182
-
183
-
184
-
185
-
186
-
187
-
188
-
189
-
190
-
191
-
192
-
193
-
194
-
195
-
196
-
197
-
198
-
199
-
200
-
201
-
202
-
203
-
204
-
205
-
206
-
207
-
208
-
209
-
210
-
211
-
212
-
213
-
214
-
215
-
216
-
217
-
218
-
219
-
220
-
221
-
222
-
223
-
224
-
225
-
226
-
227
-
228
-
229
-
230
-
231
-
232
-
233
-
234
-
235
-
236
-
237
-
238
-
239
-
240
-
241
-
242
-
243
-
244
-
245
-
246
-
247
-
248
-
249
-
250
-
251
-
252
-
253
-
254
-
255
-
256
-
257
-
258
-
259
-
260
-
261
-
262
-
263
-
264
-
265
-
266
-
267
-
268
-
269
-
270
-
271
-
272
-
273
-
274
-
275
-
276
-
277
-
278
-
279
-
280
-
281
-
282
-
283
-
284
-
285
-
286
-
287
-
288
-
289
-
290
-
291
-
292
-
293
-
294
-
295
-
296
-
297
-
298
-
299
-
300
-
301
 |
 |

Table of Contents
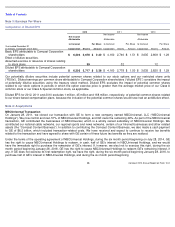
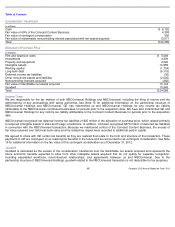
Unaudited Actual and Pro Forma Information
Our consolidated revenue and net income (loss) attributable to Comcast Corporation for the year ended December 31, 2011
included $14.5 billion and $493 million, respectively, from the NBCUniversal contributed businesses.
Our consolidated revenue and net income (loss) attributable to Comcast Corporation for the year ended December 31, 2011
included $712 million and $42 million, respectively, from the acquisition of the remaining 50% equity interest in Universal Orlando.
The following unaudited pro forma information has been presented as if both the NBCUniversal transaction and the Universal
Orlando transaction occurred on January 1, 2010. This information is based on historical results of operations, adjusted for the
allocation of purchase price and other acquisition accounting adjustments, and is not necessarily indicative of what our results would
have been had we operated the businesses since January 1, 2010. No pro forma adjustments have been made for our incremental
transaction-related expenses.
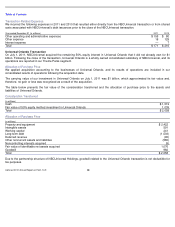
Note 5: Film and Television Costs
Based on our estimates of the ratio of the current period’
s actual revenue to the estimated total remaining gross revenue from all
sources (“ultimate revenue”),
as of December 31, 2012, approximately $1.1 billion of film and television costs associated with our
original film and television productions that have been released, or completed and not yet released, are expected to be amortized
during 2013. Approximately 87% of unamortized film and television costs for our released productions, excluding amounts allocated
to acquired libraries, are expected to be amortized through 2015.
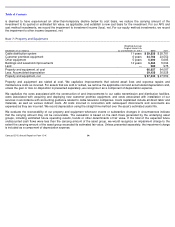
Year ended December 31 (in millions, except per share amounts)
2011
2010
Revenue
$
57,661
$
55,054
Net income
$
5,169
$
4,584
Net income attributable to Comcast Corporation
$
4,149
$
3,844
Basic earnings per common share attributable to Comcast Corporation shareholders
$
1.51
$
1.37
Diluted earnings per common share attributable to Comcast Corporation shareholders
$
1.49
$
1.36
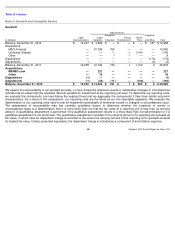
December 31 (in millions)
2012
2011
Film Costs:
Released, less amortization
$
1,472
$
1,428
Completed, not released
99
148
In production and in development
1,048
1,374
2,619
2,950
Television Costs:
Released, less amortization
1,124
1,002
In production and in development
334
201
1,458
1,203
Programming rights, less amortization
1,886
2,061
5,963
6,214
Less: Current portion of programming rights
909
987
Film and television costs
$
5,054
$
5,227
89
Comcast 2012 Annual Report on Form 10-
K