Comcast 2012 Annual Report Download - page 51
Download and view the complete annual report
Please find page 51 of the 2012 Comcast annual report below. You can navigate through the pages in the report by either clicking on the pages listed below, or by using the keyword search tool below to find specific information within the annual report.-
 1
1 -
2
-
3
-
4
-
5
-
6
-
7
-
8
-
9
-
10
-
11
-
12
-
13
-
14
-
15
-
16
-
17
-
18
-
19
-
20
-
21
-
22
-
23
-
24
-
25
-
26
-
27
-
28
-
29
-
30
-
31
-
32
-
33
-
34
-
35
-
36
-
37
-
38
-
39
-
40
-
 41
41 -
 42
42 -
 43
43 -
 44
44 -
 45
45 -
 46
46 -
 47
47 -
 48
48 -
 49
49 -
 50
50 -
 51
51 -
 52
52 -
 53
53 -
 54
54 -
 55
55 -
 56
56 -
 57
57 -
 58
58 -
 59
59 -
 60
60 -
 61
61 -
62
-
63
-
64
-
65
-
66
-
67
-
68
-
69
-
70
-
71
-
72
-
73
-
74
-
75
-
76
-
77
-
78
-
79
-
80
-
81
-
82
-
83
-
84
-
85
-
86
-
87
-
88
-
89
-
90
-
91
-
92
-
93
-
94
-
95
-
96
-
97
-
98
-
99
-
100
-
101
-
102
-
103
-
104
-
105
-
106
-
107
-
108
-
109
-
110
-
111
-
112
-
113
-
114
-
115
-
116
-
117
-
118
-
119
-
120
-
121
-
122
-
123
-
124
-
125
-
126
-
127
-
128
-
129
-
130
-
131
-
132
-
133
-
134
-
135
-
136
-
137
-
138
-
139
-
140
-
141
-
142
-
143
-
144
-
145
-
146
-
147
-
148
-
149
-
150
-
151
-
152
-
153
-
154
-
155
-
156
-
157
-
158
-
159
-
160
-
161
-
162
-
163
-
164
-
165
-
166
-
167
-
168
-
169
-
170
-
171
-
172
-
173
-
174
-
175
-
176
-
177
-
178
-
179
-
180
-
181
-
182
-
183
-
184
-
185
-
186
-
187
-
188
-
189
-
190
-
191
-
192
-
193
-
194
-
195
-
196
-
197
-
198
-
199
-
200
-
201
-
202
-
203
-
204
-
205
-
206
-
207
-
208
-
209
-
210
-
211
-
212
-
213
-
214
-
215
-
216
-
217
-
218
-
219
-
220
-
221
-
222
-
223
-
224
-
225
-
226
-
227
-
228
-
229
-
230
-
231
-
232
-
233
-
234
-
235
-
236
-
237
-
238
-
239
-
240
-
241
-
242
-
243
-
244
-
245
-
246
-
247
-
248
-
249
-
250
-
251
-
252
-
253
-
254
-
255
-
256
-
257
-
258
-
259
-
260
-
261
-
262
-
263
-
264
-
265
-
266
-
267
-
268
-
269
-
270
-
271
-
272
-
273
-
274
-
275
-
276
-
277
-
278
-
279
-
280
-
281
-
282
-
283
-
284
-
285
-
286
-
287
-
288
-
289
-
290
-
291
-
292
-
293
-
294
-
295
-
296
-
297
-
298
-
299
-
300
-
301
 |
 |

Table of Contents
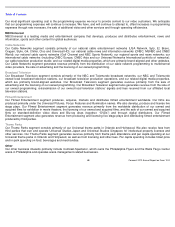
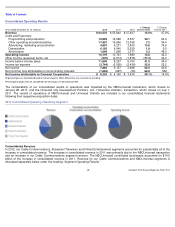
Consolidated Costs and Expenses
In 2012, our Cable Communications, Broadcast Television and Filmed Entertainment segments accounted for substantially all of the
increase in consolidated costs and expenses, excluding depreciation and amortization (consolidated “
operating costs and
expenses”).
The increase in consolidated operating costs and expenses in 2011 was primarily due to the NBCUniversal transaction
and the costs associated with the transaction, as well as an increase in our Cable Communications segment. The NBCUniversal
contributed businesses accounted for $12.3 billion of the increase in consolidated operating costs and expenses in 2011. Operating
costs and expenses for our Cable Communications and NBCUniversal segments are discussed separately below under the heading
“Segment Operating Results.”
Consolidated depreciation and amortization increased slightly in 2012 primarily due to the impact of consolidating NBCUniversal and
Universal Orlando following the close of each transaction. Consolidated depreciation and amortization increased in 2011 primarily
due to
$976 million of depreciation and amortization associated with the consolidation of NBCUniversal and Universal Orlando
following their respective acquisition dates.
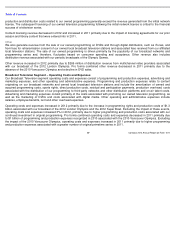
Segment Operating Results
Our segment operating results are presented based on how we assess operating performance and internally report financial
information. We use operating income (loss) before depreciation and amortization, excluding impairment charges related to fixed and
intangible assets and gains or losses from the sale of assets, if any, as the measure of profit or loss for our operating segments. This
measure eliminates the significant level of noncash depreciation and amortization expense that results from the capital-
intensive
nature of certain of our businesses and from intangible assets recognized in business combinations. Additionally, it is unaffected by
our capital structure or investment activities. We use this measure to evaluate our consolidated operating performance and the
operating performance of our operating segments and to allocate resources and capital to our operating segments. It is also a
significant performance measure in our annual incentive compensation programs. We believe that this measure is useful to investors
because it is one of the bases for comparing our operating performance with that of other companies in our industries, although our
measure may not be directly comparable to similar measures used by other companies. Because we use operating income (loss)
before depreciation and amortization to measure our segment profit or loss, we reconcile it to operating income, the most directly
comparable financial measure calculated and presented in accordance with generally accepted accounting principles in the United
States (“GAAP”)
in the business segment footnote to our consolidated financial statements (see Note 19 to our consolidated financial
statements). This measure should not be considered a substitute for operating income (loss), net income (loss) attributable to
Comcast Corporation, net cash provided by operating activities, or other measures of performance or liquidity we have reported in
accordance with GAAP.
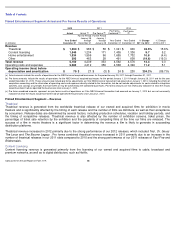
Competition
The results of operations of our reportable business segments may be affected by competition, as all of our businesses operate in
intensely competitive industries and compete with a growing number of companies that provide a broad range of communications
products and services and entertainment, news and information content to consumers. Technological changes are further
intensifying and complicating the competitive landscape and consumer behavior. For example, companies continue to emerge that
offer services or devices that enable digital distribution of movies, television shows and other video programming, and wireless
services and devices continue to evolve. Moreover, newer services that distribute video programming are also beginning to produce
or acquire their own original content. This competition is further complicated by federal and state legislative bodies and various
regulatory agencies, such as the FCC, which can adopt laws and policies that provide a favorable operating environment for some of
our existing and potential new competitors. See “Business – Competition” for additional information.
Comcast 2012 Annual Report on Form 10-K
48