Comcast 2012 Annual Report Download - page 97
Download and view the complete annual report
Please find page 97 of the 2012 Comcast annual report below. You can navigate through the pages in the report by either clicking on the pages listed below, or by using the keyword search tool below to find specific information within the annual report.-
 1
1 -
2
-
3
-
4
-
5
-
6
-
7
-
8
-
9
-
10
-
11
-
12
-
13
-
14
-
15
-
16
-
17
-
18
-
19
-
20
-
21
-
22
-
23
-
24
-
25
-
26
-
27
-
28
-
29
-
30
-
31
-
32
-
33
-
34
-
35
-
36
-
37
-
38
-
39
-
40
-
41
-
42
-
43
-
44
-
45
-
46
-
47
-
48
-
49
-
50
-
51
-
52
-
53
-
54
-
55
-
56
-
57
-
58
-
59
-
60
-
61
-
62
-
63
-
64
-
65
-
66
-
67
-
68
-
69
-
70
-
71
-
72
-
73
-
74
-
75
-
76
-
77
-
78
-
79
-
80
-
81
-
82
-
83
-
84
-
85
-
86
-
 87
87 -
 88
88 -
 89
89 -
 90
90 -
 91
91 -
 92
92 -
 93
93 -
 94
94 -
 95
95 -
 96
96 -
 97
97 -
 98
98 -
 99
99 -
 100
100 -
 101
101 -
 102
102 -
 103
103 -
 104
104 -
 105
105 -
 106
106 -
 107
107 -
108
-
109
-
110
-
111
-
112
-
113
-
114
-
115
-
116
-
117
-
118
-
119
-
120
-
121
-
122
-
123
-
124
-
125
-
126
-
127
-
128
-
129
-
130
-
131
-
132
-
133
-
134
-
135
-
136
-
137
-
138
-
139
-
140
-
141
-
142
-
143
-
144
-
145
-
146
-
147
-
148
-
149
-
150
-
151
-
152
-
153
-
154
-
155
-
156
-
157
-
158
-
159
-
160
-
161
-
162
-
163
-
164
-
165
-
166
-
167
-
168
-
169
-
170
-
171
-
172
-
173
-
174
-
175
-
176
-
177
-
178
-
179
-
180
-
181
-
182
-
183
-
184
-
185
-
186
-
187
-
188
-
189
-
190
-
191
-
192
-
193
-
194
-
195
-
196
-
197
-
198
-
199
-
200
-
201
-
202
-
203
-
204
-
205
-
206
-
207
-
208
-
209
-
210
-
211
-
212
-
213
-
214
-
215
-
216
-
217
-
218
-
219
-
220
-
221
-
222
-
223
-
224
-
225
-
226
-
227
-
228
-
229
-
230
-
231
-
232
-
233
-
234
-
235
-
236
-
237
-
238
-
239
-
240
-
241
-
242
-
243
-
244
-
245
-
246
-
247
-
248
-
249
-
250
-
251
-
252
-
253
-
254
-
255
-
256
-
257
-
258
-
259
-
260
-
261
-
262
-
263
-
264
-
265
-
266
-
267
-
268
-
269
-
270
-
271
-
272
-
273
-
274
-
275
-
276
-
277
-
278
-
279
-
280
-
281
-
282
-
283
-
284
-
285
-
286
-
287
-
288
-
289
-
290
-
291
-
292
-
293
-
294
-
295
-
296
-
297
-
298
-
299
-
300
-
301
 |
 |

Table of Contents
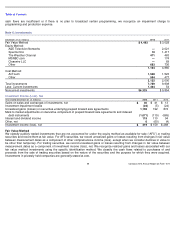
is deemed to have experienced an other-than-
temporary decline below its cost basis, we reduce the carrying amount of the
investment to its quoted or estimated fair value, as applicable, and establish a new cost basis for the investment. For our AFS and
cost method investments, we record the impairment to investment income (loss), net. For our equity method investments, we record
the impairment to other income (expense), net.
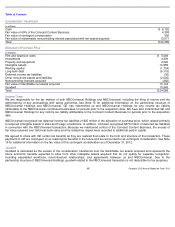
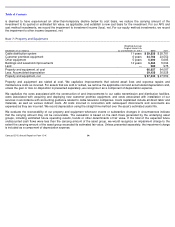
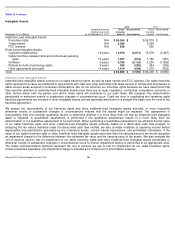
Note 7: Property and Equipment
Property and equipment are stated at cost. We
capitalize improvements that extend asset lives and expense repairs and
maintenance costs as incurred. For assets that are sold or retired, we remove the applicable cost and accumulated depreciation and,
unless the gain or loss on disposition is presented separately, we recognize it as a component of depreciation expense.
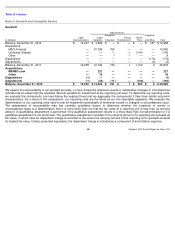
We capitalize the costs associated with the construction of and improvements to our cable transmission and distribution facilities,
costs associated with acquiring and deploying new customer premise equipment, and costs associated with installation of our
services in accordance with accounting guidance related to cable television companies. Costs capitalized include all direct labor and
materials, as well as various indirect costs. All costs incurred in connection with subsequent disconnects and reconnects are
expensed as they are incurred. We record depreciation using the straight-line method over the asset’s estimated useful life.
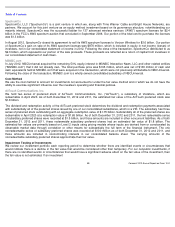
We evaluate the recoverability of our property and equipment whenever events or substantive changes in circumstances indicate
that the carrying amount may not be recoverable. The evaluation is based on the cash flows generated by the underlying asset
groups, including estimated future operating results, trends or other determinants of fair value. If the total of the expected future
undiscounted cash flows were less than the carrying amount of the asset group, we would recognize an impairment charge to the
extent the carrying amount of the asset group exceeded its estimated fair value. Unless presented separately, the impairment charge
is included as a component of depreciation expense.
December 31 (in millions)
Weighted-
Average
Original Useful Life
as of December 31, 2012
2012
2011
Cable distribution system
11 years
$
29,528
$
28,781
Customer premises equipment
6 years
24,763
23,552
Other equipment
5 years
5,909
5,685
Buildings and leasehold improvements
14 years
5,468
5,094
Land
—
989
975
Property and equipment, at cost
66,657
64,087
Less: Accumulated depreciation
39,425
36,528
Property and equipment, net
$
27,232
$
27,559
Comcast 2012 Annual Report on Form 10-K
94