Comcast 2012 Annual Report Download - page 102
Download and view the complete annual report
Please find page 102 of the 2012 Comcast annual report below. You can navigate through the pages in the report by either clicking on the pages listed below, or by using the keyword search tool below to find specific information within the annual report.-
 1
1 -
2
-
3
-
4
-
5
-
6
-
7
-
8
-
9
-
10
-
11
-
12
-
13
-
14
-
15
-
16
-
17
-
18
-
19
-
20
-
21
-
22
-
23
-
24
-
25
-
26
-
27
-
28
-
29
-
30
-
31
-
32
-
33
-
34
-
35
-
36
-
37
-
38
-
39
-
40
-
41
-
42
-
43
-
44
-
45
-
46
-
47
-
48
-
49
-
50
-
51
-
52
-
53
-
54
-
55
-
56
-
57
-
58
-
59
-
60
-
61
-
62
-
63
-
64
-
65
-
66
-
67
-
68
-
69
-
70
-
71
-
72
-
73
-
74
-
75
-
76
-
77
-
78
-
79
-
80
-
81
-
82
-
83
-
84
-
85
-
86
-
87
-
88
-
89
-
90
-
91
-
 92
92 -
 93
93 -
 94
94 -
 95
95 -
 96
96 -
 97
97 -
 98
98 -
 99
99 -
 100
100 -
 101
101 -
 102
102 -
 103
103 -
 104
104 -
 105
105 -
 106
106 -
 107
107 -
 108
108 -
 109
109 -
 110
110 -
 111
111 -
 112
112 -
113
-
114
-
115
-
116
-
117
-
118
-
119
-
120
-
121
-
122
-
123
-
124
-
125
-
126
-
127
-
128
-
129
-
130
-
131
-
132
-
133
-
134
-
135
-
136
-
137
-
138
-
139
-
140
-
141
-
142
-
143
-
144
-
145
-
146
-
147
-
148
-
149
-
150
-
151
-
152
-
153
-
154
-
155
-
156
-
157
-
158
-
159
-
160
-
161
-
162
-
163
-
164
-
165
-
166
-
167
-
168
-
169
-
170
-
171
-
172
-
173
-
174
-
175
-
176
-
177
-
178
-
179
-
180
-
181
-
182
-
183
-
184
-
185
-
186
-
187
-
188
-
189
-
190
-
191
-
192
-
193
-
194
-
195
-
196
-
197
-
198
-
199
-
200
-
201
-
202
-
203
-
204
-
205
-
206
-
207
-
208
-
209
-
210
-
211
-
212
-
213
-
214
-
215
-
216
-
217
-
218
-
219
-
220
-
221
-
222
-
223
-
224
-
225
-
226
-
227
-
228
-
229
-
230
-
231
-
232
-
233
-
234
-
235
-
236
-
237
-
238
-
239
-
240
-
241
-
242
-
243
-
244
-
245
-
246
-
247
-
248
-
249
-
250
-
251
-
252
-
253
-
254
-
255
-
256
-
257
-
258
-
259
-
260
-
261
-
262
-
263
-
264
-
265
-
266
-
267
-
268
-
269
-
270
-
271
-
272
-
273
-
274
-
275
-
276
-
277
-
278
-
279
-
280
-
281
-
282
-
283
-
284
-
285
-
286
-
287
-
288
-
289
-
290
-
291
-
292
-
293
-
294
-
295
-
296
-
297
-
298
-
299
-
300
-
301
 |
 |

Table of Contents
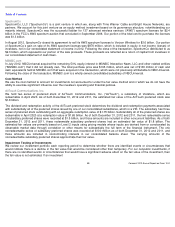
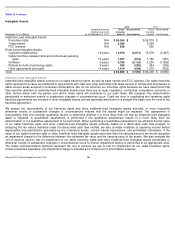
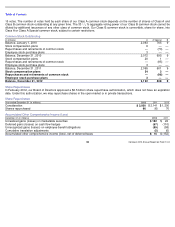
Revolving Credit Facilities
In June 2012, Comcast and Comcast Cable Communications, LLC entered into a new $6.25 billion revolving credit facility due June
2017 with a syndicate of banks that may be used for general corporate purposes. The new credit facility replaces our prior $6.8
billion credit facility, which was terminated in connection with the execution of the new credit facility. The interest rate on the new
facility consists of a base rate plus a borrowing margin that is determined based on Comcast’
s credit rating. As of December 31,
2012, the borrowing margin for LIBOR-based borrowings was 1.125%. The terms of the new credit facility’
s financial covenants and
guarantees are substantially the same as those under the prior credit facility. As of December 31, 2012, amounts available under the
new credit facility, net of amounts outstanding under our commercial paper program and undrawn letters of credit, totaled $5.8
billion.
As of December 31, 2012, NBCUniversal had a $1.5 billion credit facility due June 2016 with a syndicate of banks. The interest rate
on this facility consists of a base rate plus a borrowing margin that is determined based on NBCUniversal’
s credit rating. As of
December 31, 2012, the borrowing margin for LIBOR-
based borrowings was 1.125%. As of December 31, 2012, amounts available
under this credit facility, net of amounts outstanding under our commercial paper program and undrawn letters of credit, totaled $1.4
billion.
Letters of Credit
As of December 31, 2012, we and certain of our subsidiaries had unused irrevocable standby letters of credit totaling $557 million to
cover potential fundings under various agreements.
Note 10: Fair Value Measurements
The accounting guidance related to financial assets and financial liabilities (“financial instruments”)
establishes a hierarchy that
prioritizes fair value measurements based on the types of inputs used for the various valuation techniques (market approach, income
approach and cost approach). The levels of the hierarchy are described below.
•
Level 1: Consists of financial instruments whose values are based on quoted market prices for identical
financial instruments in an active market.
•
Level 2: Consists of financial instruments that are valued using models or other valuation methodologies.
These models use inputs that are observable either directly or indirectly. Level 2 inputs include (i) quoted
prices for similar assets or liabilities in active markets, (ii) quoted prices for identical or similar assets or
liabilities in markets that are not active, (iii) pricing models whose inputs are observable for substantially
the full term of the financial instrument and (iv) pricing models whose inputs are derived principally from or
corroborated by observable market data through correlation or other means for substantially the full term
of the financial instrument.
•
Level 3: Consists of financial instruments whose values are determined using pricing models that use
significant inputs that are primarily unobservable, discounted cash flow methodologies or similar
techniques, as well as instruments for which the determination of fair value requires significant
management judgment or estimation.
99
Comcast 2012 Annual Report on Form 10
-
K