Comcast 2012 Annual Report Download - page 67
Download and view the complete annual report
Please find page 67 of the 2012 Comcast annual report below. You can navigate through the pages in the report by either clicking on the pages listed below, or by using the keyword search tool below to find specific information within the annual report.-
 1
1 -
2
-
3
-
4
-
5
-
6
-
7
-
8
-
9
-
10
-
11
-
12
-
13
-
14
-
15
-
16
-
17
-
18
-
19
-
20
-
21
-
22
-
23
-
24
-
25
-
26
-
27
-
28
-
29
-
30
-
31
-
32
-
33
-
34
-
35
-
36
-
37
-
38
-
39
-
40
-
41
-
42
-
43
-
44
-
45
-
46
-
47
-
48
-
49
-
50
-
51
-
52
-
53
-
54
-
55
-
56
-
 57
57 -
 58
58 -
 59
59 -
 60
60 -
 61
61 -
 62
62 -
 63
63 -
 64
64 -
 65
65 -
 66
66 -
 67
67 -
 68
68 -
 69
69 -
 70
70 -
 71
71 -
 72
72 -
 73
73 -
 74
74 -
 75
75 -
 76
76 -
 77
77 -
78
-
79
-
80
-
81
-
82
-
83
-
84
-
85
-
86
-
87
-
88
-
89
-
90
-
91
-
92
-
93
-
94
-
95
-
96
-
97
-
98
-
99
-
100
-
101
-
102
-
103
-
104
-
105
-
106
-
107
-
108
-
109
-
110
-
111
-
112
-
113
-
114
-
115
-
116
-
117
-
118
-
119
-
120
-
121
-
122
-
123
-
124
-
125
-
126
-
127
-
128
-
129
-
130
-
131
-
132
-
133
-
134
-
135
-
136
-
137
-
138
-
139
-
140
-
141
-
142
-
143
-
144
-
145
-
146
-
147
-
148
-
149
-
150
-
151
-
152
-
153
-
154
-
155
-
156
-
157
-
158
-
159
-
160
-
161
-
162
-
163
-
164
-
165
-
166
-
167
-
168
-
169
-
170
-
171
-
172
-
173
-
174
-
175
-
176
-
177
-
178
-
179
-
180
-
181
-
182
-
183
-
184
-
185
-
186
-
187
-
188
-
189
-
190
-
191
-
192
-
193
-
194
-
195
-
196
-
197
-
198
-
199
-
200
-
201
-
202
-
203
-
204
-
205
-
206
-
207
-
208
-
209
-
210
-
211
-
212
-
213
-
214
-
215
-
216
-
217
-
218
-
219
-
220
-
221
-
222
-
223
-
224
-
225
-
226
-
227
-
228
-
229
-
230
-
231
-
232
-
233
-
234
-
235
-
236
-
237
-
238
-
239
-
240
-
241
-
242
-
243
-
244
-
245
-
246
-
247
-
248
-
249
-
250
-
251
-
252
-
253
-
254
-
255
-
256
-
257
-
258
-
259
-
260
-
261
-
262
-
263
-
264
-
265
-
266
-
267
-
268
-
269
-
270
-
271
-
272
-
273
-
274
-
275
-
276
-
277
-
278
-
279
-
280
-
281
-
282
-
283
-
284
-
285
-
286
-
287
-
288
-
289
-
290
-
291
-
292
-
293
-
294
-
295
-
296
-
297
-
298
-
299
-
300
-
301
 |
 |

Table of Contents
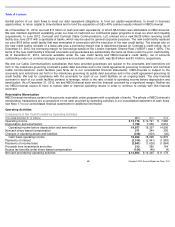
The changes in operating assets and liabilities in 2012, compared to the changes in 2011, were primarily related to a decrease in film
and television costs, partially offset by the settlement in 2012 of a $237 million liability associated with the unfavorable Olympic
contract that had been recorded through the application of acquisition accounting in 2011, as well as the timing of other operating
items, including accounts receivable and accounts payable related to trade creditors. The changes in operating assets and liabilities
in 2011, compared to the changes in 2010, were primarily related to the timing of payments of operating items and payroll, and an
increase in film and television costs.
The decrease in interest payments in 2012 was primarily due to the repayment and redemption of certain of our debt obligations. The
increase in interest payments in 2011 was primarily due to an increase in our outstanding debt as a result of the NBCUniversal
transaction.
The increase in income tax payments in 2012 was primarily due to increases in taxable income, which resulted in higher federal tax
payments made in 2012, and the lower net benefit in 2012 of the economic stimulus legislation. The decrease in income tax
payments in 2011 was primarily due to the net income tax benefit in 2011 of the 2010 economic stimulus legislation.
Investing Activities
Net cash used in investing activities in 2012 consisted primarily of cash paid for capital expenditures, cash paid for intangible assets
and the purchase of investments, substantially offset by proceeds from sales of businesses and investments and return of capital
from investees. Net cash used in investing activities in 2011 and 2010 consisted primarily of capital expenditures and, in 2011, the
acquisitions of NBCUniversal and Universal Orlando.
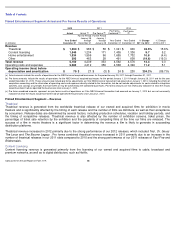
Capital Expenditures
Our most significant recurring investing activity has been capital expenditures in our Cable Communications segment, and we expect
that this will continue in the future. The table below summarizes the capital expenditures we incurred in our Cable Communications
segment in 2012, 2011 and 2010.
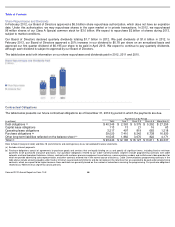
Cable Communications capital expenditures increased in 2012 primarily due to an increase in equipment purchases and increased
investment in business services and network capacity. Cable Communications capital expenditures decreased slightly in 2011
primarily due to fewer equipment purchases and improved equipment pricing, partially offset by increased investment in business
services and network capacity.
Capital expenditures in our NBCUniversal segments increased 75.7% to $763 million in 2012 primarily due to increased investment
at our Universal theme parks and increased investment in technical infrastructure to support our cable networks and broadcast
television operations. Capital expenditures in our NBCUniversal segments were not significant in 2011.
Capital expenditures for 2013 and for subsequent years will depend on numerous factors, including acquisitions, competition,
changes in technology, regulatory changes, and the timing and rate of deployment of new services and capacity for existing services.
In addition, we have invested and expect to continue to invest in existing and new attractions at our Universal theme parks.
Year ended December 31 (in millions)
2012
2011
2010
Cable distribution system
$
1,720
$
1,715
$
1,553
Customer premises equipment
2,678
2,594
2,864
Other equipment
462
420
370
Buildings and building improvements
57
77
66
Land
4
—
—
Total
$
4,921
$
4,806
$
4,853
Comcast 2012 Annual Report on Form 10-K
64