Comcast 2012 Annual Report Download - page 50
Download and view the complete annual report
Please find page 50 of the 2012 Comcast annual report below. You can navigate through the pages in the report by either clicking on the pages listed below, or by using the keyword search tool below to find specific information within the annual report.-
 1
1 -
2
-
3
-
4
-
5
-
6
-
7
-
8
-
9
-
10
-
11
-
12
-
13
-
14
-
15
-
16
-
17
-
18
-
19
-
20
-
21
-
22
-
23
-
24
-
25
-
26
-
27
-
28
-
29
-
30
-
31
-
32
-
33
-
34
-
35
-
36
-
37
-
38
-
39
-
 40
40 -
 41
41 -
 42
42 -
 43
43 -
 44
44 -
 45
45 -
 46
46 -
 47
47 -
 48
48 -
 49
49 -
 50
50 -
 51
51 -
 52
52 -
 53
53 -
 54
54 -
 55
55 -
 56
56 -
 57
57 -
 58
58 -
 59
59 -
 60
60 -
61
-
62
-
63
-
64
-
65
-
66
-
67
-
68
-
69
-
70
-
71
-
72
-
73
-
74
-
75
-
76
-
77
-
78
-
79
-
80
-
81
-
82
-
83
-
84
-
85
-
86
-
87
-
88
-
89
-
90
-
91
-
92
-
93
-
94
-
95
-
96
-
97
-
98
-
99
-
100
-
101
-
102
-
103
-
104
-
105
-
106
-
107
-
108
-
109
-
110
-
111
-
112
-
113
-
114
-
115
-
116
-
117
-
118
-
119
-
120
-
121
-
122
-
123
-
124
-
125
-
126
-
127
-
128
-
129
-
130
-
131
-
132
-
133
-
134
-
135
-
136
-
137
-
138
-
139
-
140
-
141
-
142
-
143
-
144
-
145
-
146
-
147
-
148
-
149
-
150
-
151
-
152
-
153
-
154
-
155
-
156
-
157
-
158
-
159
-
160
-
161
-
162
-
163
-
164
-
165
-
166
-
167
-
168
-
169
-
170
-
171
-
172
-
173
-
174
-
175
-
176
-
177
-
178
-
179
-
180
-
181
-
182
-
183
-
184
-
185
-
186
-
187
-
188
-
189
-
190
-
191
-
192
-
193
-
194
-
195
-
196
-
197
-
198
-
199
-
200
-
201
-
202
-
203
-
204
-
205
-
206
-
207
-
208
-
209
-
210
-
211
-
212
-
213
-
214
-
215
-
216
-
217
-
218
-
219
-
220
-
221
-
222
-
223
-
224
-
225
-
226
-
227
-
228
-
229
-
230
-
231
-
232
-
233
-
234
-
235
-
236
-
237
-
238
-
239
-
240
-
241
-
242
-
243
-
244
-
245
-
246
-
247
-
248
-
249
-
250
-
251
-
252
-
253
-
254
-
255
-
256
-
257
-
258
-
259
-
260
-
261
-
262
-
263
-
264
-
265
-
266
-
267
-
268
-
269
-
270
-
271
-
272
-
273
-
274
-
275
-
276
-
277
-
278
-
279
-
280
-
281
-
282
-
283
-
284
-
285
-
286
-
287
-
288
-
289
-
290
-
291
-
292
-
293
-
294
-
295
-
296
-
297
-
298
-
299
-
300
-
301
 |
 |
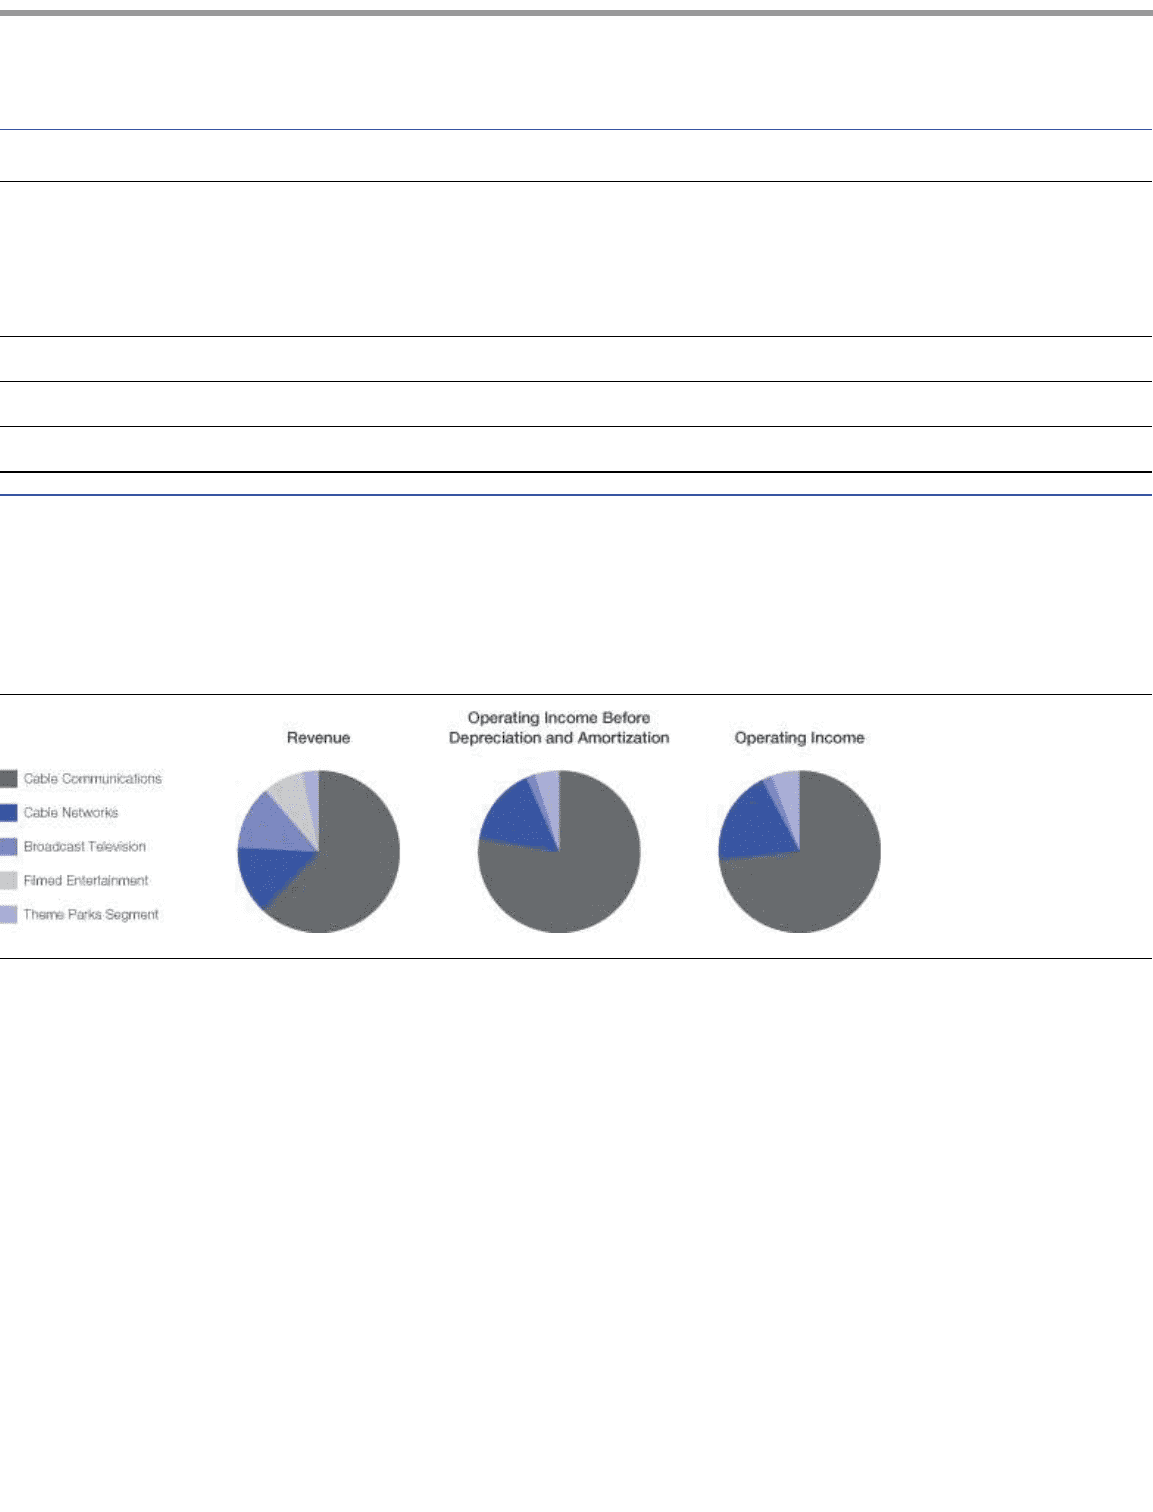
Table of Contents
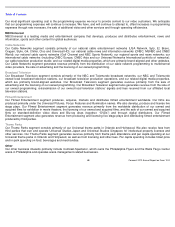
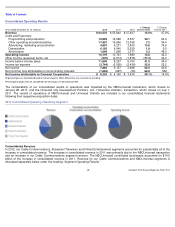
Consolidated Operating Results
All percentages are calculated based on actual amounts. Minor differences may exist due to rounding.
Percentage changes that are considered not meaningful are denoted with NM.
The comparability of our consolidated results of operations was impacted by the NBCUniversal transaction, which closed on
January 28, 2011, and the Universal City Development Partners, Ltd. (“Universal Orlando”)
transaction, which closed on July 1,
2011. The results of operations of NBCUniversal and Universal Orlando are included in our consolidated financial statements
following their respective acquisition dates.
2012 Consolidated Operating Results by Segment
Consolidated Revenue
In 2012, our Cable Communications, Broadcast Television and Filmed Entertainment segments accounted for substantially all of the
increase in consolidated revenue. The increase in consolidated revenue in 2011 was primarily due to the NBCUniversal transaction
and an increase in our Cable Communications segment revenue. The NBCUniversal contributed businesses accounted for $14.5
billion of the increase in consolidated revenue in 2011. Revenue for our Cable Communications and NBCUniversal segments is
discussed separately below under the heading “Segment Operating Results.”
Year ended December 31 (in millions)
2012
2011
2010
% Change
2011 to 2012
% Change
2010 to 2011
Revenue
$
62,570
$
55,842
$
37,937
12.0
%
47.2
%
Costs and Expenses:
Programming and production
19,929
16,598
8,537
20.1
94.4
Other operating and administrative
17,857
16,656
12,395
7.2
34.4
Advertising, marketing and promotion
4,807
4,231
2,409
13.6
75.6
Depreciation
6,150
6,040
5,539
1.8
9.0
Amortization
1,648
1,596
1,077
3.3
48.3
Operating income
12,179
10,721
7,980
13.6
34.3
Other income (expense) items, net
(570
)
(2,514
)
(1,876
)
(77.3
)
34.0
Income before income taxes
11,609
8,207
6,104
41.5
34.4
Income tax expense
(3,744
)
(3,050
)
(2,436
)
22.8
25.2
Net income
7,865
5,157
3,668
52.5
40.6
Net (income) loss attributable to noncontrolling interests
(1,662
)
(997
)
(33
)
66.8
NM
Net income attributable to Comcast Corporation
$
6,203
$
4,160
$
3,635
49.1
%
14.5
%
47
Comcast 2012 Annual Report on Form 10
-
K