Comcast 2012 Annual Report Download - page 108
Download and view the complete annual report
Please find page 108 of the 2012 Comcast annual report below. You can navigate through the pages in the report by either clicking on the pages listed below, or by using the keyword search tool below to find specific information within the annual report.-
 1
1 -
2
-
3
-
4
-
5
-
6
-
7
-
8
-
9
-
10
-
11
-
12
-
13
-
14
-
15
-
16
-
17
-
18
-
19
-
20
-
21
-
22
-
23
-
24
-
25
-
26
-
27
-
28
-
29
-
30
-
31
-
32
-
33
-
34
-
35
-
36
-
37
-
38
-
39
-
40
-
41
-
42
-
43
-
44
-
45
-
46
-
47
-
48
-
49
-
50
-
51
-
52
-
53
-
54
-
55
-
56
-
57
-
58
-
59
-
60
-
61
-
62
-
63
-
64
-
65
-
66
-
67
-
68
-
69
-
70
-
71
-
72
-
73
-
74
-
75
-
76
-
77
-
78
-
79
-
80
-
81
-
82
-
83
-
84
-
85
-
86
-
87
-
88
-
89
-
90
-
91
-
92
-
93
-
94
-
95
-
96
-
97
-
 98
98 -
 99
99 -
 100
100 -
 101
101 -
 102
102 -
 103
103 -
 104
104 -
 105
105 -
 106
106 -
 107
107 -
 108
108 -
 109
109 -
 110
110 -
 111
111 -
 112
112 -
 113
113 -
 114
114 -
 115
115 -
 116
116 -
 117
117 -
 118
118 -
119
-
120
-
121
-
122
-
123
-
124
-
125
-
126
-
127
-
128
-
129
-
130
-
131
-
132
-
133
-
134
-
135
-
136
-
137
-
138
-
139
-
140
-
141
-
142
-
143
-
144
-
145
-
146
-
147
-
148
-
149
-
150
-
151
-
152
-
153
-
154
-
155
-
156
-
157
-
158
-
159
-
160
-
161
-
162
-
163
-
164
-
165
-
166
-
167
-
168
-
169
-
170
-
171
-
172
-
173
-
174
-
175
-
176
-
177
-
178
-
179
-
180
-
181
-
182
-
183
-
184
-
185
-
186
-
187
-
188
-
189
-
190
-
191
-
192
-
193
-
194
-
195
-
196
-
197
-
198
-
199
-
200
-
201
-
202
-
203
-
204
-
205
-
206
-
207
-
208
-
209
-
210
-
211
-
212
-
213
-
214
-
215
-
216
-
217
-
218
-
219
-
220
-
221
-
222
-
223
-
224
-
225
-
226
-
227
-
228
-
229
-
230
-
231
-
232
-
233
-
234
-
235
-
236
-
237
-
238
-
239
-
240
-
241
-
242
-
243
-
244
-
245
-
246
-
247
-
248
-
249
-
250
-
251
-
252
-
253
-
254
-
255
-
256
-
257
-
258
-
259
-
260
-
261
-
262
-
263
-
264
-
265
-
266
-
267
-
268
-
269
-
270
-
271
-
272
-
273
-
274
-
275
-
276
-
277
-
278
-
279
-
280
-
281
-
282
-
283
-
284
-
285
-
286
-
287
-
288
-
289
-
290
-
291
-
292
-
293
-
294
-
295
-
296
-
297
-
298
-
299
-
300
-
301
 |
 |

Table of Contents
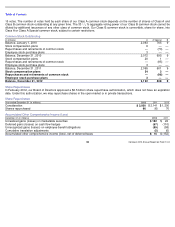
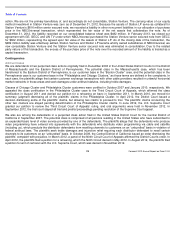
15 votes. The number of votes held by each share of our Class A common stock depends on the number of shares of Class A and
Class B common stock outstanding at any given time. The 33 /
% aggregate voting power of our Class B common stock cannot be
diluted by additional issuances of any other class of common stock. Our Class B common stock is convertible, share for share, into
Class A or Class A Special common stock, subject to certain restrictions.
Common Stock Outstanding
Share Repurchases
In February 2012, our Board of Directors approved a $6.5 billion share repurchase authorization, which does not have an expiration
date. Under this authorization, we may repurchase shares in the open market or in private transactions.
Share Repurchases
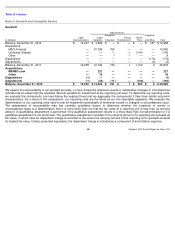
Accumulated Other Comprehensive Income (Loss)
(in millions)
A
A Special
B
Balance, January 1, 2010
2,063
765
9
Stock compensation plans
6
—
—
Repurchases and retirements of common stock
—
(
70
)
—
Employee stock purchase plans
3
—
—
Balance, December 31, 2010
2,072
695
9
Stock compensation plans
20
1
—
Repurchases and retirements of common stock
—
(
95
)
—
Employee stock purchase plans
3
—
—
Balance, December 31, 2011
2,095
601
9
Stock compensation plans
24
3
—
Repurchases and retirements of common stock
—
(
96
)
—
Employee stock purchase plans
3
—
—
Balance, December 31, 2012
2,122
508
9
Year ended December 31 (in millions)
2012
2011
2010
Consideration
$
3,000
$
2,141
$
1,200
Shares repurchased
96
95
70
December 31 (in millions)
2012
2011
Unrealized gains (losses) on marketable securities
$
182
$
22
Deferred gains (losses) on cash flow hedges
(67
)
(110
)
Unrecognized gains (losses) on employee benefit obligations
(95
)
(58
)
Cumulative translation adjustments
(5
)
(6
)
Accumulated other comprehensive income (loss), net of deferred taxes
$
15
$
(152
)
105
Comcast 2012 Annual Report on Form 10
-
K
1
3