Comcast 2012 Annual Report Download - page 114
Download and view the complete annual report
Please find page 114 of the 2012 Comcast annual report below. You can navigate through the pages in the report by either clicking on the pages listed below, or by using the keyword search tool below to find specific information within the annual report.-
 1
1 -
2
-
3
-
4
-
5
-
6
-
7
-
8
-
9
-
10
-
11
-
12
-
13
-
14
-
15
-
16
-
17
-
18
-
19
-
20
-
21
-
22
-
23
-
24
-
25
-
26
-
27
-
28
-
29
-
30
-
31
-
32
-
33
-
34
-
35
-
36
-
37
-
38
-
39
-
40
-
41
-
42
-
43
-
44
-
45
-
46
-
47
-
48
-
49
-
50
-
51
-
52
-
53
-
54
-
55
-
56
-
57
-
58
-
59
-
60
-
61
-
62
-
63
-
64
-
65
-
66
-
67
-
68
-
69
-
70
-
71
-
72
-
73
-
74
-
75
-
76
-
77
-
78
-
79
-
80
-
81
-
82
-
83
-
84
-
85
-
86
-
87
-
88
-
89
-
90
-
91
-
92
-
93
-
94
-
95
-
96
-
97
-
98
-
99
-
100
-
101
-
102
-
103
-
 104
104 -
 105
105 -
 106
106 -
 107
107 -
 108
108 -
 109
109 -
 110
110 -
 111
111 -
 112
112 -
 113
113 -
 114
114 -
 115
115 -
 116
116 -
 117
117 -
 118
118 -
 119
119 -
 120
120 -
 121
121 -
 122
122 -
 123
123 -
 124
124 -
125
-
126
-
127
-
128
-
129
-
130
-
131
-
132
-
133
-
134
-
135
-
136
-
137
-
138
-
139
-
140
-
141
-
142
-
143
-
144
-
145
-
146
-
147
-
148
-
149
-
150
-
151
-
152
-
153
-
154
-
155
-
156
-
157
-
158
-
159
-
160
-
161
-
162
-
163
-
164
-
165
-
166
-
167
-
168
-
169
-
170
-
171
-
172
-
173
-
174
-
175
-
176
-
177
-
178
-
179
-
180
-
181
-
182
-
183
-
184
-
185
-
186
-
187
-
188
-
189
-
190
-
191
-
192
-
193
-
194
-
195
-
196
-
197
-
198
-
199
-
200
-
201
-
202
-
203
-
204
-
205
-
206
-
207
-
208
-
209
-
210
-
211
-
212
-
213
-
214
-
215
-
216
-
217
-
218
-
219
-
220
-
221
-
222
-
223
-
224
-
225
-
226
-
227
-
228
-
229
-
230
-
231
-
232
-
233
-
234
-
235
-
236
-
237
-
238
-
239
-
240
-
241
-
242
-
243
-
244
-
245
-
246
-
247
-
248
-
249
-
250
-
251
-
252
-
253
-
254
-
255
-
256
-
257
-
258
-
259
-
260
-
261
-
262
-
263
-
264
-
265
-
266
-
267
-
268
-
269
-
270
-
271
-
272
-
273
-
274
-
275
-
276
-
277
-
278
-
279
-
280
-
281
-
282
-
283
-
284
-
285
-
286
-
287
-
288
-
289
-
290
-
291
-
292
-
293
-
294
-
295
-
296
-
297
-
298
-
299
-
300
-
301
 |
 |

Table of Contents
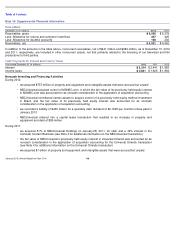
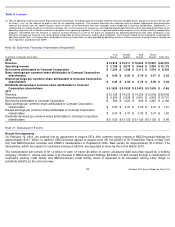
During 2010:
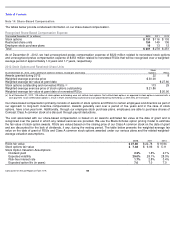
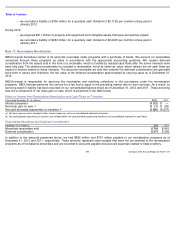
Note 17: Receivables Monetization
NBCUniversal monetizes certain of its accounts receivable under programs with a syndicate of banks. We account for receivables
monetized through these programs as sales in accordance with the appropriate accounting guidance. We receive deferred
consideration from the assets sold in the form of a receivable, which is funded by residual cash flows after the senior interests have
been fully paid. The deferred consideration is included in receivables, net at its initial fair value, which reflects the net cash flows we
expect to receive related to these interests. The accounts receivable we sold that underlie the deferred consideration are generally
short-
term in nature and, therefore, the fair value of the deferred consideration approximated its carrying value as of December 31,
2012.
NBCUniversal is responsible for servicing the receivables and remitting collections to the purchasers under the monetization
programs. NBCUniversal performs this service for a fee that is equal to the prevailing market rate for such services. As a result, no
servicing asset or liability has been recorded on our consolidated balance sheet as of December 31, 2012 and 2011. These servicing
fees are a component of net (loss) gain on sale, which is presented in the table below.
Effect on Income from Receivables Monetization and Cash Flows on Transfers
Receivables Monetized and Deferred Consideration
In addition to the amounts presented above, we had $882 million and $781 million payable to our monetization programs as of
December 31, 2012 and 2011, respectively. These amounts represent cash receipts that were not yet remitted to the monetization
programs as of the balance sheet date and are recorded to accounts payable and accrued expenses related to trade creditors.
•
we recorded a liability of $305 million for a quarterly cash dividend of $0.1125 per common share paid in
January 2012
•
we acquired $611 million of property and equipment and intangible assets that were accrued but unpaid
•
we recorded a liability of $263 million for a quarterly cash dividend of $0.0945 per common share paid in
January 2011
Year ended December 31 (in millions)
2012
2011
Interest (expense)
$
(12
)
$
—
Net (loss) gain on sale
$
(1
)
$
(36
)
Net cash proceeds (payments) on transfers
$
(86
)
$
(237
)
(a)
Net (loss) gain on sale is included in other income (expense), net in our consolidated statement of income.
(b)
Net cash proceeds (payments) on transfers are included within net cash provided by operating activities in our consolidated statement of cash flows.
December 31 (in millions)
2012
2011
Monetized receivables sold
$
791
$
961
Deferred consideration
$
274
$
268
111
Comcast 2012 Annual Report on Form 10-
K
(a)
(b)