Chrysler 2008 Annual Report Download - page 92
Download and view the complete annual report
Please find page 92 of the 2008 Chrysler annual report below. You can navigate through the pages in the report by either clicking on the pages listed below, or by using the keyword search tool below to find specific information within the annual report.-
 1
1 -
2
-
3
-
4
-
5
-
6
-
7
-
8
-
9
-
10
-
11
-
12
-
13
-
14
-
15
-
16
-
17
-
18
-
19
-
20
-
21
-
22
-
23
-
24
-
25
-
26
-
27
-
28
-
29
-
30
-
31
-
32
-
33
-
34
-
35
-
36
-
37
-
38
-
39
-
40
-
41
-
42
-
43
-
44
-
45
-
46
-
47
-
48
-
49
-
50
-
51
-
52
-
53
-
54
-
55
-
56
-
57
-
58
-
59
-
60
-
61
-
62
-
63
-
64
-
65
-
66
-
67
-
68
-
69
-
70
-
71
-
72
-
73
-
74
-
75
-
76
-
77
-
78
-
79
-
80
-
81
-
 82
82 -
 83
83 -
 84
84 -
 85
85 -
 86
86 -
 87
87 -
 88
88 -
 89
89 -
 90
90 -
 91
91 -
 92
92 -
 93
93 -
 94
94 -
 95
95 -
 96
96 -
 97
97 -
 98
98 -
 99
99 -
 100
100 -
 101
101 -
 102
102 -
103
-
104
-
105
-
106
-
107
-
108
-
109
-
110
-
111
-
112
-
113
-
114
-
115
-
116
-
117
-
118
-
119
-
120
-
121
-
122
-
123
-
124
-
125
-
126
-
127
-
128
-
129
-
130
-
131
-
132
-
133
-
134
-
135
-
136
-
137
-
138
-
139
-
140
-
141
-
142
-
143
-
144
-
145
-
146
-
147
-
148
-
149
-
150
-
151
-
152
-
153
-
154
-
155
-
156
-
157
-
158
-
159
-
160
-
161
-
162
-
163
-
164
-
165
-
166
-
167
-
168
-
169
-
170
-
171
-
172
-
173
-
174
-
175
-
176
-
177
-
178
-
179
-
180
-
181
-
182
-
183
-
184
-
185
-
186
-
187
-
188
-
189
-
190
-
191
-
192
-
193
-
194
-
195
-
196
-
197
-
198
-
199
-
200
-
201
-
202
-
203
-
204
-
205
-
206
-
207
-
208
-
209
-
210
-
211
-
212
-
213
-
214
-
215
-
216
-
217
-
218
-
219
-
220
-
221
-
222
-
223
-
224
-
225
-
226
-
227
-
228
-
229
-
230
-
231
-
232
-
233
-
234
-
235
-
236
-
237
-
238
-
239
-
240
-
241
-
242
-
243
-
244
-
245
-
246
-
247
-
248
-
249
-
250
-
251
-
252
-
253
-
254
-
255
-
256
-
257
-
258
-
259
-
260
-
261
-
262
-
263
-
264
-
265
-
266
-
267
-
268
-
269
-
270
-
271
-
272
-
273
-
274
-
275
-
276
-
277
-
278
-
279
-
280
-
281
-
282
-
283
-
284
-
285
-
286
-
287
-
288
-
289
-
290
-
291
-
292
-
293
-
294
-
295
-
296
-
297
-
298
-
299
-
300
-
301
-
302
-
303
-
304
-
305
-
306
-
307
-
308
-
309
-
310
-
311
-
312
-
313
-
314
-
315
-
316
-
317
-
318
-
319
-
320
-
321
-
322
-
323
-
324
-
325
-
326
-
327
-
328
-
329
-
330
-
331
-
332
-
333
-
334
-
335
-
336
-
337
-
338
-
339
-
340
-
341
-
342
-
343
-
344
-
345
-
346
-
347
-
348
-
349
-
350
-
351
-
352
-
353
-
354
-
355
-
356
 |
 |

Report on Operations Comau 91
Operating Performance
In 2008, the underlying trend for the Sector’s reference market
reflected persisting uncertainty in volumes and price pressure.
In the western hemisphere, automakers generally scaled-down
investment, even though new model launches continued. In
fact, there was a demonstrated tendency to conversion and
rationalisation of existing production capacity rather than
greenfield investment.
Conversely, investment was more robust in a number of Asian
countries and in the Mercosur region.
The last three months of the year, however, were negatively
influenced by the financial and industrial crisis that affected
all countries.
Nonetheless, Comau posted a slight increase in revenues
(+3.1%), attributable to the Body Welding business in Europe
and Services in Latin America.
The plan to restructure and reshape the scope of activities and
geographic presence, which Comau launched at the end of
2006 to tackle difficult market conditions, produced positive
effects on the Sector’s profitability, with trading profit of €21
million, after losses being recorded for the past two years.
In 2008, Comau sold its Engineering and Plastic Components
businesses to other companies of the Fiat Group.
Despite continuing difficult market conditions, order intake for
2008 totalled €1,063 million, in line with the previous year on a
like-for-like basis.
In 2008, new orders for contract work, totalling €855 million,
were 10.7% lower than in 2007 (but in line with the prior year
on a like-for-like basis). Overall, 47% of new contract orders
were acquired in Europe and 25% in the NAFTA region, with
the remaining 28% in the Mercosur region and emerging
markets (13% in China). By customer, 41% of orders were
received from Fiat Group companies and 59% from other
automakers. At 31 December 2008, the order backlog for
contract work totalled €523 million, in line with 2007 on a
comparable scope of operations.
With regard to new orders for the Service business in 2008,
the increase in the Mercosur region (21%) was offset by a
contraction in Europe, in line with the change in the scope
of operations.
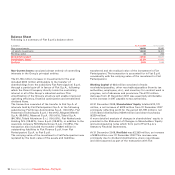
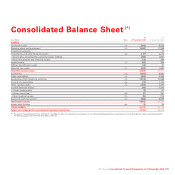
Highlights
(€ millions) 2008 2007
Net revenues 1,123 1,089
Trading profit 21 (23)
Operating profit (*) –(33)
Investments in tangible and intangible assets 17 33
- of which, capitalised R&D costs 34
Total R&D expenditure (**) 13 12
No. of employees at year end 11,445 11,960
(*) Includes restructuring costs and net unusual income/(expense).
(**)Includes capitalised R&D and R&D charged directly to the income statement.
Production Systems – Comau