Chrysler 2008 Annual Report Download - page 50
Download and view the complete annual report
Please find page 50 of the 2008 Chrysler annual report below. You can navigate through the pages in the report by either clicking on the pages listed below, or by using the keyword search tool below to find specific information within the annual report.-
 1
1 -
2
-
3
-
4
-
5
-
6
-
7
-
8
-
9
-
10
-
11
-
12
-
13
-
14
-
15
-
16
-
17
-
18
-
19
-
20
-
21
-
22
-
23
-
24
-
25
-
26
-
27
-
28
-
29
-
30
-
31
-
32
-
33
-
34
-
35
-
36
-
37
-
38
-
39
-
 40
40 -
 41
41 -
 42
42 -
 43
43 -
 44
44 -
 45
45 -
 46
46 -
 47
47 -
 48
48 -
 49
49 -
 50
50 -
 51
51 -
 52
52 -
 53
53 -
 54
54 -
 55
55 -
 56
56 -
 57
57 -
 58
58 -
 59
59 -
 60
60 -
61
-
62
-
63
-
64
-
65
-
66
-
67
-
68
-
69
-
70
-
71
-
72
-
73
-
74
-
75
-
76
-
77
-
78
-
79
-
80
-
81
-
82
-
83
-
84
-
85
-
86
-
87
-
88
-
89
-
90
-
91
-
92
-
93
-
94
-
95
-
96
-
97
-
98
-
99
-
100
-
101
-
102
-
103
-
104
-
105
-
106
-
107
-
108
-
109
-
110
-
111
-
112
-
113
-
114
-
115
-
116
-
117
-
118
-
119
-
120
-
121
-
122
-
123
-
124
-
125
-
126
-
127
-
128
-
129
-
130
-
131
-
132
-
133
-
134
-
135
-
136
-
137
-
138
-
139
-
140
-
141
-
142
-
143
-
144
-
145
-
146
-
147
-
148
-
149
-
150
-
151
-
152
-
153
-
154
-
155
-
156
-
157
-
158
-
159
-
160
-
161
-
162
-
163
-
164
-
165
-
166
-
167
-
168
-
169
-
170
-
171
-
172
-
173
-
174
-
175
-
176
-
177
-
178
-
179
-
180
-
181
-
182
-
183
-
184
-
185
-
186
-
187
-
188
-
189
-
190
-
191
-
192
-
193
-
194
-
195
-
196
-
197
-
198
-
199
-
200
-
201
-
202
-
203
-
204
-
205
-
206
-
207
-
208
-
209
-
210
-
211
-
212
-
213
-
214
-
215
-
216
-
217
-
218
-
219
-
220
-
221
-
222
-
223
-
224
-
225
-
226
-
227
-
228
-
229
-
230
-
231
-
232
-
233
-
234
-
235
-
236
-
237
-
238
-
239
-
240
-
241
-
242
-
243
-
244
-
245
-
246
-
247
-
248
-
249
-
250
-
251
-
252
-
253
-
254
-
255
-
256
-
257
-
258
-
259
-
260
-
261
-
262
-
263
-
264
-
265
-
266
-
267
-
268
-
269
-
270
-
271
-
272
-
273
-
274
-
275
-
276
-
277
-
278
-
279
-
280
-
281
-
282
-
283
-
284
-
285
-
286
-
287
-
288
-
289
-
290
-
291
-
292
-
293
-
294
-
295
-
296
-
297
-
298
-
299
-
300
-
301
-
302
-
303
-
304
-
305
-
306
-
307
-
308
-
309
-
310
-
311
-
312
-
313
-
314
-
315
-
316
-
317
-
318
-
319
-
320
-
321
-
322
-
323
-
324
-
325
-
326
-
327
-
328
-
329
-
330
-
331
-
332
-
333
-
334
-
335
-
336
-
337
-
338
-
339
-
340
-
341
-
342
-
343
-
344
-
345
-
346
-
347
-
348
-
349
-
350
-
351
-
352
-
353
-
354
-
355
-
356
 |
 |

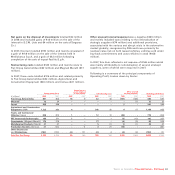
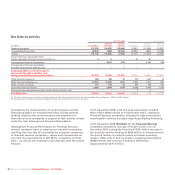
Report on Operations Financial Review – Fiat Group 49
Operating Performance by Activity
2008 2007
Industrial Financial Industrial Financial
(€ millions) Consolidated Activities Services Consolidated Activities Services
Net revenues 59,380 58,309 1,477 58,529 57,533 1,410
Cost of sales 49,423 48,840 989 48,924 48,428 910
Selling, general and administrative 5,075 4,899 176 4,924 4,747 177
Research and development 1,497 1,497 – 1,536 1,536 –
Other income/(expense) (23) (35) 12 88 72 16
Trading profit 3,362 3,038 324 3,233 2,894 339
Gains/(losses) on disposal of investments 20 16 4 190 188 2
Restructuring costs 165 160 5 105 104 1
Other unusual income/(expense) (245) (242) (3) (166) (104) (62)
Operating profit/(loss) 2,972 2,652 320 3,152 2,874 278
Financial income/(expense) (947) (947) – (564) (564) –
Result from investments (*) 162 84 78 185 110 75
- Net result of investees accounted for using the equity method 133 54 79 210 135 75
- Other income/(expense) from investments 29 30 (1) (25) (25) –
Profit before taxes 2,187 1,789 398 2,773 2,420 353
Income taxes 466 368 98 719 635 84
Profit for the year 1,721 1,421 300 2,054 1,785 269
Profit/(loss) on intersegment investments –300 4 – 269 –
Profit for the year 1,721 1,721 304 2,054 2,054 269
(*) This item includes income from investments as well as impairment losses/reversals on non-intersegment investments accounted for under the equity method.
Industrial Activities
In 2008, Net Revenues for Industrial Activities increased 1.3%
over the prior year: the optimum first half performance (+11%)
was eroded in the second half (-8%), particularly in the fourth
quarter (-17.7% over 2007). Growth was driven by CNH – Case
New Holland, whose revenues were up 8.1% (+16% in US dollar
terms), and by Components and Production Systems (+3.1%),
where increases for Magneti Marelli (+8.9%; in line with 2007
on a like-for-like basis), Teksid (+6.9%; +3.0% on a like-for-like
basis) and Comau (+3.1%) more than compensated for the 1.1%
decrease at FPT Powertrain Technologies. Revenues increased
1.2% for the Automobiles business. Revenues for Iveco were
down 4.4%, principally attributable to lower sales volumes in
Europe. Deliveries declined significantly in the second half of
the year in contrast to the positive performance in the first half.
Trading Profit for Industrial Activities was €3,038 million, an
improvement of €144 million with respect to the €2,894 million
recorded in 2007. All industrial businesses contributed to the
increase, with a particularly strong contribution from CNH –
Case New Holland, while trading profit for the Components
and Production Systems business declined: FPT Powertrain
Technologies and Magneti Marelli were particularly impacted
by falls in sales volumes, primarily in the fourth quarter of
2008.
Industrial Activities reported Operating Profit of €2,652 million,
compared with €2,874 million for 2007. The difference is
attributable to the €144 million improvement in trading profit,
more than offset by a €366 million increase in net unusual
expense (€386 million in 2008; €20 million in 2007).