Chrysler 2008 Annual Report Download - page 157
Download and view the complete annual report
Please find page 157 of the 2008 Chrysler annual report below. You can navigate through the pages in the report by either clicking on the pages listed below, or by using the keyword search tool below to find specific information within the annual report.-
 1
1 -
2
-
3
-
4
-
5
-
6
-
7
-
8
-
9
-
10
-
11
-
12
-
13
-
14
-
15
-
16
-
17
-
18
-
19
-
20
-
21
-
22
-
23
-
24
-
25
-
26
-
27
-
28
-
29
-
30
-
31
-
32
-
33
-
34
-
35
-
36
-
37
-
38
-
39
-
40
-
41
-
42
-
43
-
44
-
45
-
46
-
47
-
48
-
49
-
50
-
51
-
52
-
53
-
54
-
55
-
56
-
57
-
58
-
59
-
60
-
61
-
62
-
63
-
64
-
65
-
66
-
67
-
68
-
69
-
70
-
71
-
72
-
73
-
74
-
75
-
76
-
77
-
78
-
79
-
80
-
81
-
82
-
83
-
84
-
85
-
86
-
87
-
88
-
89
-
90
-
91
-
92
-
93
-
94
-
95
-
96
-
97
-
98
-
99
-
100
-
101
-
102
-
103
-
104
-
105
-
106
-
107
-
108
-
109
-
110
-
111
-
112
-
113
-
114
-
115
-
116
-
117
-
118
-
119
-
120
-
121
-
122
-
123
-
124
-
125
-
126
-
127
-
128
-
129
-
130
-
131
-
132
-
133
-
134
-
135
-
136
-
137
-
138
-
139
-
140
-
141
-
142
-
143
-
144
-
145
-
146
-
 147
147 -
 148
148 -
 149
149 -
 150
150 -
 151
151 -
 152
152 -
 153
153 -
 154
154 -
 155
155 -
 156
156 -
 157
157 -
 158
158 -
 159
159 -
 160
160 -
 161
161 -
 162
162 -
 163
163 -
 164
164 -
 165
165 -
 166
166 -
 167
167 -
168
-
169
-
170
-
171
-
172
-
173
-
174
-
175
-
176
-
177
-
178
-
179
-
180
-
181
-
182
-
183
-
184
-
185
-
186
-
187
-
188
-
189
-
190
-
191
-
192
-
193
-
194
-
195
-
196
-
197
-
198
-
199
-
200
-
201
-
202
-
203
-
204
-
205
-
206
-
207
-
208
-
209
-
210
-
211
-
212
-
213
-
214
-
215
-
216
-
217
-
218
-
219
-
220
-
221
-
222
-
223
-
224
-
225
-
226
-
227
-
228
-
229
-
230
-
231
-
232
-
233
-
234
-
235
-
236
-
237
-
238
-
239
-
240
-
241
-
242
-
243
-
244
-
245
-
246
-
247
-
248
-
249
-
250
-
251
-
252
-
253
-
254
-
255
-
256
-
257
-
258
-
259
-
260
-
261
-
262
-
263
-
264
-
265
-
266
-
267
-
268
-
269
-
270
-
271
-
272
-
273
-
274
-
275
-
276
-
277
-
278
-
279
-
280
-
281
-
282
-
283
-
284
-
285
-
286
-
287
-
288
-
289
-
290
-
291
-
292
-
293
-
294
-
295
-
296
-
297
-
298
-
299
-
300
-
301
-
302
-
303
-
304
-
305
-
306
-
307
-
308
-
309
-
310
-
311
-
312
-
313
-
314
-
315
-
316
-
317
-
318
-
319
-
320
-
321
-
322
-
323
-
324
-
325
-
326
-
327
-
328
-
329
-
330
-
331
-
332
-
333
-
334
-
335
-
336
-
337
-
338
-
339
-
340
-
341
-
342
-
343
-
344
-
345
-
346
-
347
-
348
-
349
-
350
-
351
-
352
-
353
-
354
-
355
-
356
 |
 |

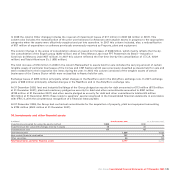
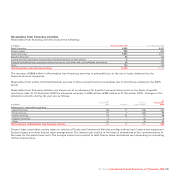
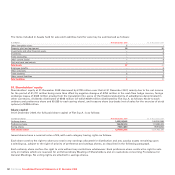
The item may be analysed as follows stated gross of an allowance of €75 million at 31 December 2008 (€91 million at 31 December 2007):
At 31 December 2008 At 31 December 2007
Due between Due between
Due within one and Due beyond Due within one and Due beyond
(€ millions) one year five years five years Total one year five years five years Total
Receivables for future minimum lease payments 438 622 57 1,117 356 509 21 886
Less: unrealised interest income (60) (86) (11) (157) (46) (57) (2) (105)
Present value of future minimum lease payments 378 536 46 960 310 452 19 781
There are no contingent rents as finance lease recognised income during 2008 or 2007 and unguaranteed residual values at
31 December 2008 and 2007 are not significant.
Receivables for dealer financing are typically generated by sales of vehicles and are generally managed under dealer network
financing programs as a component of the portfolio of the financial services companies. These receivables are interest bearing,
with the exception of an initial limited, non-interest bearing period. The contractual terms governing the relationships with the
dealer networks vary from Sector to Sector and from country to country, although these receivables are on average collected after
a period ranging from two to six months.
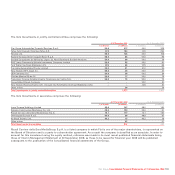
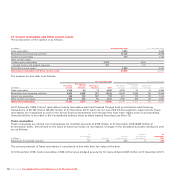
The fair value of receivables from financing activities at 31 December 2008 amounts approximately to €13,329 million (€12,285
million at 31 December 2007) and has been calculated using a discounted cash flow method based on the following discount rates,
adjusted, where necessary, to take account of the specific risk of insolvency of the underlying financial instrument.
In % EUR USD GBP CAD AUD BRL PLN
Interest rate for six months 2.97 1.75 2.96 1.87 4.74 12.67 5.95
Interest rate for one year 3.05 2.00 3.07 1.91 4.65 12.17 4.43
Interest rate for five years 3.27 2.15 3.18 1.63 4.28 12.54 4.19
Other current assets
At 31 December 2008, Other current assets mainly consist of Other tax receivables for VAT and other indirect taxes of
€1,617 million (€1,076 million at 31 December 2007), Receivables from employees of €51 million (€41 million at 31 December 2007)
and Accrued income and prepaid expenses of €227 million (€241 million at 31 December 2007).
At the balance sheet date the carrying amount of Other current assets is considered to be in line with their fair value.
Fiat Group Consolidated Financial Statements at 31 December 2008156