Chrysler 2008 Annual Report Download - page 190
Download and view the complete annual report
Please find page 190 of the 2008 Chrysler annual report below. You can navigate through the pages in the report by either clicking on the pages listed below, or by using the keyword search tool below to find specific information within the annual report.-
 1
1 -
2
-
3
-
4
-
5
-
6
-
7
-
8
-
9
-
10
-
11
-
12
-
13
-
14
-
15
-
16
-
17
-
18
-
19
-
20
-
21
-
22
-
23
-
24
-
25
-
26
-
27
-
28
-
29
-
30
-
31
-
32
-
33
-
34
-
35
-
36
-
37
-
38
-
39
-
40
-
41
-
42
-
43
-
44
-
45
-
46
-
47
-
48
-
49
-
50
-
51
-
52
-
53
-
54
-
55
-
56
-
57
-
58
-
59
-
60
-
61
-
62
-
63
-
64
-
65
-
66
-
67
-
68
-
69
-
70
-
71
-
72
-
73
-
74
-
75
-
76
-
77
-
78
-
79
-
80
-
81
-
82
-
83
-
84
-
85
-
86
-
87
-
88
-
89
-
90
-
91
-
92
-
93
-
94
-
95
-
96
-
97
-
98
-
99
-
100
-
101
-
102
-
103
-
104
-
105
-
106
-
107
-
108
-
109
-
110
-
111
-
112
-
113
-
114
-
115
-
116
-
117
-
118
-
119
-
120
-
121
-
122
-
123
-
124
-
125
-
126
-
127
-
128
-
129
-
130
-
131
-
132
-
133
-
134
-
135
-
136
-
137
-
138
-
139
-
140
-
141
-
142
-
143
-
144
-
145
-
146
-
147
-
148
-
149
-
150
-
151
-
152
-
153
-
154
-
155
-
156
-
157
-
158
-
159
-
160
-
161
-
162
-
163
-
164
-
165
-
166
-
167
-
168
-
169
-
170
-
171
-
172
-
173
-
174
-
175
-
176
-
177
-
178
-
179
-
 180
180 -
 181
181 -
 182
182 -
 183
183 -
 184
184 -
 185
185 -
 186
186 -
 187
187 -
 188
188 -
 189
189 -
 190
190 -
 191
191 -
 192
192 -
 193
193 -
 194
194 -
 195
195 -
 196
196 -
 197
197 -
 198
198 -
 199
199 -
 200
200 -
201
-
202
-
203
-
204
-
205
-
206
-
207
-
208
-
209
-
210
-
211
-
212
-
213
-
214
-
215
-
216
-
217
-
218
-
219
-
220
-
221
-
222
-
223
-
224
-
225
-
226
-
227
-
228
-
229
-
230
-
231
-
232
-
233
-
234
-
235
-
236
-
237
-
238
-
239
-
240
-
241
-
242
-
243
-
244
-
245
-
246
-
247
-
248
-
249
-
250
-
251
-
252
-
253
-
254
-
255
-
256
-
257
-
258
-
259
-
260
-
261
-
262
-
263
-
264
-
265
-
266
-
267
-
268
-
269
-
270
-
271
-
272
-
273
-
274
-
275
-
276
-
277
-
278
-
279
-
280
-
281
-
282
-
283
-
284
-
285
-
286
-
287
-
288
-
289
-
290
-
291
-
292
-
293
-
294
-
295
-
296
-
297
-
298
-
299
-
300
-
301
-
302
-
303
-
304
-
305
-
306
-
307
-
308
-
309
-
310
-
311
-
312
-
313
-
314
-
315
-
316
-
317
-
318
-
319
-
320
-
321
-
322
-
323
-
324
-
325
-
326
-
327
-
328
-
329
-
330
-
331
-
332
-
333
-
334
-
335
-
336
-
337
-
338
-
339
-
340
-
341
-
342
-
343
-
344
-
345
-
346
-
347
-
348
-
349
-
350
-
351
-
352
-
353
-
354
-
355
-
356
 |
 |

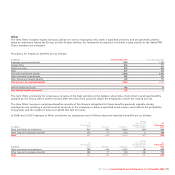
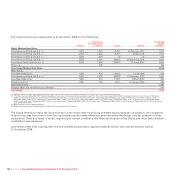
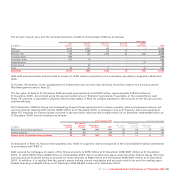
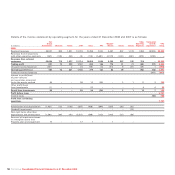
The annual interest rates and the nominal currencies of debt at 31 December 2008 are as follows:
Interest rate
less from 5% from 7.5% from 10% greater
(€ millions) than 5% to 7.5% to 10% to 12.5% than 12.5% Total
Euro 4,974 6,211 83 – 1 11,269
US dollar 4,726 1,288 53 12 – 6,079
Brazilian real 162 123 1,293 61 829 2,468
Canadian dollar 849 – – – – 849
Australian dollar 307 75 – – – 382
Argentine peso – – – – 47 47
British pound – 40 – – – 40
Other 39 150 11 – 45 245
Total Debt 11,057 7,887 1,440 73 922 21,379
Debt with annual nominal interest rates in excess of 12.5% relates principally to the companies operating in Argentina, Brazil and
India.
For further information on the management of interest rate and currency risk reference should be made to the previous section
Risk Management and to Note 33.
The fair value of Debt at 31 December 2008 amounts approximately to €19,932 million (approximately €18,014 million at
31 December 2007), determined using the quoted market price of financial instruments, if available, or the related future cash
flows. The amount is calculated using the interest rates stated in Note 19, suitably adjusted to take account of the Group’s current
creditworthiness.
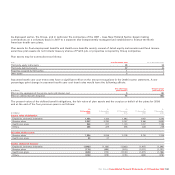
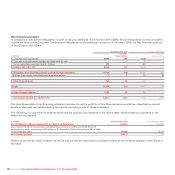
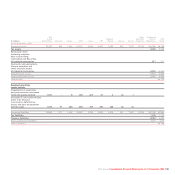
At 31 December 2008 the Group had outstanding financial lease agreements for certain property, plant and equipment whose net
carrying amount totalling €310 million (€249 million at 31 December 2007) is included in the item Property, plant and equipment
(Note 15). Payables for finance leases included in the item Other debt amount to €276 million at 31 December 2008 (€228 million at
31 December 2007) and are analysed as follows:
At 31 December 2008 At 31 December 2007
Due between Due between
Due within one and Due beyond Due within one and Due beyond
(€ millions) one year five years five years Total one year five years five years Total
Minimum future lease payments 55 116 109 280 56 118 58 232
Interest expense (2) (2) – (4) (2) (2) – (4)
Present value of minimum lease payments 53 114 109 276 54 116 58 228
As discussed in Note 15, finance lease payables also relate to suppliers’ assets recognised in the Consolidated financial statements
in accordance with IFRIC 4.
Debt secured by mortgages on assets of the Group amounts to €378 million at 31 December 2008 (€357 million at 31 December
2007), of which €276 million (€228 million at 31 December 2007) due to creditors for assets acquired under finance leases. The total
carrying amount of assets acting as security for loans amounts to €466 million at 31 December 2008 (€411 million at 31 December
2007). In addition, it is recalled that the group’s assets include current receivables and set-aside cash to be used for settling asset-
backed financing of €6,663 million at 31 December 2008 (€6,820 million at 31 December 2007).
Fiat Group Consolidated Financial Statements at 31 December 2008 189