Chrysler 2008 Annual Report Download - page 149
Download and view the complete annual report
Please find page 149 of the 2008 Chrysler annual report below. You can navigate through the pages in the report by either clicking on the pages listed below, or by using the keyword search tool below to find specific information within the annual report.-
 1
1 -
2
-
3
-
4
-
5
-
6
-
7
-
8
-
9
-
10
-
11
-
12
-
13
-
14
-
15
-
16
-
17
-
18
-
19
-
20
-
21
-
22
-
23
-
24
-
25
-
26
-
27
-
28
-
29
-
30
-
31
-
32
-
33
-
34
-
35
-
36
-
37
-
38
-
39
-
40
-
41
-
42
-
43
-
44
-
45
-
46
-
47
-
48
-
49
-
50
-
51
-
52
-
53
-
54
-
55
-
56
-
57
-
58
-
59
-
60
-
61
-
62
-
63
-
64
-
65
-
66
-
67
-
68
-
69
-
70
-
71
-
72
-
73
-
74
-
75
-
76
-
77
-
78
-
79
-
80
-
81
-
82
-
83
-
84
-
85
-
86
-
87
-
88
-
89
-
90
-
91
-
92
-
93
-
94
-
95
-
96
-
97
-
98
-
99
-
100
-
101
-
102
-
103
-
104
-
105
-
106
-
107
-
108
-
109
-
110
-
111
-
112
-
113
-
114
-
115
-
116
-
117
-
118
-
119
-
120
-
121
-
122
-
123
-
124
-
125
-
126
-
127
-
128
-
129
-
130
-
131
-
132
-
133
-
134
-
135
-
136
-
137
-
138
-
 139
139 -
 140
140 -
 141
141 -
 142
142 -
 143
143 -
 144
144 -
 145
145 -
 146
146 -
 147
147 -
 148
148 -
 149
149 -
 150
150 -
 151
151 -
 152
152 -
 153
153 -
 154
154 -
 155
155 -
 156
156 -
 157
157 -
 158
158 -
 159
159 -
160
-
161
-
162
-
163
-
164
-
165
-
166
-
167
-
168
-
169
-
170
-
171
-
172
-
173
-
174
-
175
-
176
-
177
-
178
-
179
-
180
-
181
-
182
-
183
-
184
-
185
-
186
-
187
-
188
-
189
-
190
-
191
-
192
-
193
-
194
-
195
-
196
-
197
-
198
-
199
-
200
-
201
-
202
-
203
-
204
-
205
-
206
-
207
-
208
-
209
-
210
-
211
-
212
-
213
-
214
-
215
-
216
-
217
-
218
-
219
-
220
-
221
-
222
-
223
-
224
-
225
-
226
-
227
-
228
-
229
-
230
-
231
-
232
-
233
-
234
-
235
-
236
-
237
-
238
-
239
-
240
-
241
-
242
-
243
-
244
-
245
-
246
-
247
-
248
-
249
-
250
-
251
-
252
-
253
-
254
-
255
-
256
-
257
-
258
-
259
-
260
-
261
-
262
-
263
-
264
-
265
-
266
-
267
-
268
-
269
-
270
-
271
-
272
-
273
-
274
-
275
-
276
-
277
-
278
-
279
-
280
-
281
-
282
-
283
-
284
-
285
-
286
-
287
-
288
-
289
-
290
-
291
-
292
-
293
-
294
-
295
-
296
-
297
-
298
-
299
-
300
-
301
-
302
-
303
-
304
-
305
-
306
-
307
-
308
-
309
-
310
-
311
-
312
-
313
-
314
-
315
-
316
-
317
-
318
-
319
-
320
-
321
-
322
-
323
-
324
-
325
-
326
-
327
-
328
-
329
-
330
-
331
-
332
-
333
-
334
-
335
-
336
-
337
-
338
-
339
-
340
-
341
-
342
-
343
-
344
-
345
-
346
-
347
-
348
-
349
-
350
-
351
-
352
-
353
-
354
-
355
-
356
 |
 |

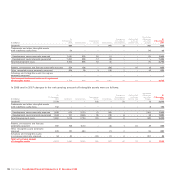
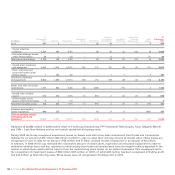
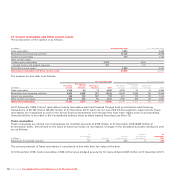
At Change in Reclassified At
31 December Impairment the scope of Translation to Assets Other 31 December
(€ millions) 2006 Additions Depreciation losses Divestitures consolidation differences held for sale changes 2007
Land 447 6 – – (3) 18 1 – 6 475
- Owned industrial
buildings 2,220 184 (142) – (9) 30 22 (12) 16 2,309
- Industrial buildings leased
under finance leases 59 1 (3) – – 3 – – (1) 59
Total Industrial buildings 2,279 185 (145) – (9) 33 22 (12) 15 2,368
- Owned plant, machinery
and equipment 5,597 1,203 (1,515) (19) (71) 107 48 (3) 571 5,918
- Plant, machinery and
equipment leased under
finance leases 7 182 (6) – – 1 1 – 2 187
Total Plant, machinery
and equipment 5,604 1,385 (1,521) (19) (71) 108 49 (3) 573 6,105
Assets sold with a buy-back
commitment 1,157 383 (144) (8) (249) – (11) – 2 1,130
- Owned other tangible
assets 400 242 (115) (1) (91) 2 (2) (1) (16) 418
- Other tangible assets
leased under finance leases 4 1 (2) – – – – – – 3
Total Other tangible assets 404 243 (117) (1) (91) 2 (2) (1) (16) 421
Advances and tangible
assets in progress 649 725 – – (5) 6 9 – (637) 747
Total net carrying amount
of Property, plant and
equipment 10,540 2,927 (1,927) (28) (428) 167 68 (16) (57) 11,246
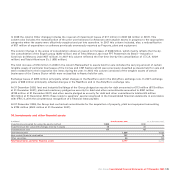
Additions of €3,894 million in 2008 mainly relate to Fiat Group Automobiles, FPT Powertrain Technologies, Iveco, Magneti Marelli
and CNH – Case New Holland and do not include capitalised borrowing costs.
During 2008 the Group recognised impairment losses on Assets sold with a buy-back commitment from Trucks and Commercial
Vehicles for an amount of €12 million (€8 million in 2007) in order to align their carrying amount to market value. These losses are
recognised in Cost of sales for an amount of €8 million and in Other unusual income (expenses) for an amount of €4 million.
In addition, in 2008 the Group reviewed the recoverable amount of certain plant, machinery and industrial equipment in order to
determine whether there was any reduction in value arising from technical obsolescence from the negative effects expected in the
market in which those assets will be used or from the restructuring plans drawn up for certain businesses. This assessment led to
the recognition of impairment losses of €38 million (€20 million in 2007), of which €24 million has been recognised in Trading profit
and €14 million as Restructuring costs. These losses were all recognised in Trading profit in 2007.
Fiat Group Consolidated Financial Statements at 31 December 2008148