Chrysler 2008 Annual Report Download - page 71
Download and view the complete annual report
Please find page 71 of the 2008 Chrysler annual report below. You can navigate through the pages in the report by either clicking on the pages listed below, or by using the keyword search tool below to find specific information within the annual report.-
 1
1 -
2
-
3
-
4
-
5
-
6
-
7
-
8
-
9
-
10
-
11
-
12
-
13
-
14
-
15
-
16
-
17
-
18
-
19
-
20
-
21
-
22
-
23
-
24
-
25
-
26
-
27
-
28
-
29
-
30
-
31
-
32
-
33
-
34
-
35
-
36
-
37
-
38
-
39
-
40
-
41
-
42
-
43
-
44
-
45
-
46
-
47
-
48
-
49
-
50
-
51
-
52
-
53
-
54
-
55
-
56
-
57
-
58
-
59
-
60
-
 61
61 -
 62
62 -
 63
63 -
 64
64 -
 65
65 -
 66
66 -
 67
67 -
 68
68 -
 69
69 -
 70
70 -
 71
71 -
 72
72 -
 73
73 -
 74
74 -
 75
75 -
 76
76 -
 77
77 -
 78
78 -
 79
79 -
 80
80 -
 81
81 -
82
-
83
-
84
-
85
-
86
-
87
-
88
-
89
-
90
-
91
-
92
-
93
-
94
-
95
-
96
-
97
-
98
-
99
-
100
-
101
-
102
-
103
-
104
-
105
-
106
-
107
-
108
-
109
-
110
-
111
-
112
-
113
-
114
-
115
-
116
-
117
-
118
-
119
-
120
-
121
-
122
-
123
-
124
-
125
-
126
-
127
-
128
-
129
-
130
-
131
-
132
-
133
-
134
-
135
-
136
-
137
-
138
-
139
-
140
-
141
-
142
-
143
-
144
-
145
-
146
-
147
-
148
-
149
-
150
-
151
-
152
-
153
-
154
-
155
-
156
-
157
-
158
-
159
-
160
-
161
-
162
-
163
-
164
-
165
-
166
-
167
-
168
-
169
-
170
-
171
-
172
-
173
-
174
-
175
-
176
-
177
-
178
-
179
-
180
-
181
-
182
-
183
-
184
-
185
-
186
-
187
-
188
-
189
-
190
-
191
-
192
-
193
-
194
-
195
-
196
-
197
-
198
-
199
-
200
-
201
-
202
-
203
-
204
-
205
-
206
-
207
-
208
-
209
-
210
-
211
-
212
-
213
-
214
-
215
-
216
-
217
-
218
-
219
-
220
-
221
-
222
-
223
-
224
-
225
-
226
-
227
-
228
-
229
-
230
-
231
-
232
-
233
-
234
-
235
-
236
-
237
-
238
-
239
-
240
-
241
-
242
-
243
-
244
-
245
-
246
-
247
-
248
-
249
-
250
-
251
-
252
-
253
-
254
-
255
-
256
-
257
-
258
-
259
-
260
-
261
-
262
-
263
-
264
-
265
-
266
-
267
-
268
-
269
-
270
-
271
-
272
-
273
-
274
-
275
-
276
-
277
-
278
-
279
-
280
-
281
-
282
-
283
-
284
-
285
-
286
-
287
-
288
-
289
-
290
-
291
-
292
-
293
-
294
-
295
-
296
-
297
-
298
-
299
-
300
-
301
-
302
-
303
-
304
-
305
-
306
-
307
-
308
-
309
-
310
-
311
-
312
-
313
-
314
-
315
-
316
-
317
-
318
-
319
-
320
-
321
-
322
-
323
-
324
-
325
-
326
-
327
-
328
-
329
-
330
-
331
-
332
-
333
-
334
-
335
-
336
-
337
-
338
-
339
-
340
-
341
-
342
-
343
-
344
-
345
-
346
-
347
-
348
-
349
-
350
-
351
-
352
-
353
-
354
-
355
-
356
 |
 |

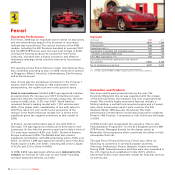
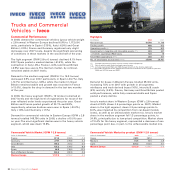
Report on Operations Fiat Group Automobiles70
Fiat Group Automobiles — Fiat, Abarth,
Alfa Romeo, Lancia & Fiat Professional
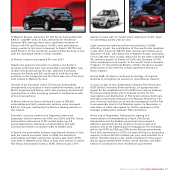
Commercial Performance
In 2008, the passenger vehicle market in Western Europe
declined 8.4% over 2007.
This result was influenced by marked decreases in demand in
Italy (-13.4%), Spain (-28.1%) and Great Britain (-11.3%), while
lesser declines were reported in Germany (-1.8%) and France
(-0.7%).
Outside of Western Europe, growth in the Sector’s key markets
continued following already positive performance in 2007. In
Poland, demand for passenger vehicles increased 9.4%.
Registrations in Brazil rose 10.6% year on year, with strong
growth in the first half of 2008, however, being partially offset
by declines in the latter part of the year.
The market for light commercial vehicles in Western Europe
declined 10.1% over 2007, with demand falling 8.7% in Italy,
39.7% in Spain, 12.9% in Great Britain, and 0.8% in France, but
rising 1.4% in Germany.
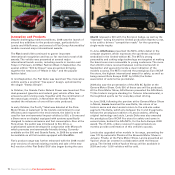
In 2008, despite decidedly unfavourable conditions, the Sector
continued to gain share in the passenger vehicle market. In
Italy, share increased 0.6 percentage points during the year to
reach 31.9%, while in Western Europe it was up 0.2 percentage
points to 8.2%. The Fiat brand, in particular, gained market
share in Western Europe, improving from 6.2% in 2007 to 6.6%
in 2008. In Italy, market share increased to 25.1% (+0.9
percentage points).
Fiat Group Automobiles’ market share for light commercial
vehicles in Italy reached 43.2%, a 1.1 percentage point
improvement over 2007, while in Western Europe it reached
12.3%, up 0.6 percentage points.
In Brazil, market share for passenger vehicles was 24.9% in
2008 (down 1 percentage point) and for light commercial
vehicles it was 23% (-3.2 percentage points).
During 2008, Fiat Group Automobiles delivered a total of
2,152,500 passenger vehicles and light commercial vehicles,
representing a 3.6% decline from 2007.
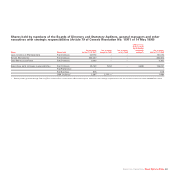
Highlights
(€ millions) 2008 2007
Net revenues 26,937 26,812
Trading profit 691 803
Operating profit (*) 460 635
Investments in tangible and intangible assets 2,288 1,865
- of which, capitalised R&D costs 641 493
Total R&D expenditure (**) 843 751
Automobiles and light commercial vehicles
delivered (no. of units) 2,152,500 2,233,800
No. of employees at year end 52,634 50,542
(*) Includes restructuring costs and net unusual income/(expense).
(**) Includes capitalised R&D and R&D charged directly to the income statement.
Automobile Market
(units in thousands) 2008 2007 % change
France 2,050.3 2,064.5 -0.7
Germany 3,090.0 3,148.2 -1.8
Great Britain 2,131.8 2,404.0 -11.3
Italy 2,160.1 2,493.1 -13.4
Spain 1,161.2 1,614.8 -28.1
Western Europe 13,558.4 14,797.6 -8.4
Poland 320.0 292.4 9.4
Brazil 2,237.3 2,022.3 10.6
Sales Performance
Automobiles and Light Commercial Vehicles
(units in thousands) 2008 2007 % change
France 123.8 94.7 30.7
Germany 122.8 107.3 14.4
Great Britain 71.4 77.7 -8.1
Italy 718.1 854.6 -16.0
Spain 48.7 79.4 -38.7
Rest of Western Europe 153.1 143.3 6.8
Western Europe 1,237.9 1,357.0 -8.8
Poland 41,6 39.1 6.5
Brazil 665.6 613.1 8.6
Rest-of-World 207.4 224.6 -7.6
Total sales 2,152.5 2,233.8 -3.6
Associate companies (*) 76.5 90.6 -15.5
Grand total 2,229.0 2,324.4 -4.1
(*) Figures for 2007 have been restated to include vehicles assembled and sold in Russia.
This activity began in the closing months of 2007.