Chrysler 2008 Annual Report Download - page 191
Download and view the complete annual report
Please find page 191 of the 2008 Chrysler annual report below. You can navigate through the pages in the report by either clicking on the pages listed below, or by using the keyword search tool below to find specific information within the annual report.-
 1
1 -
2
-
3
-
4
-
5
-
6
-
7
-
8
-
9
-
10
-
11
-
12
-
13
-
14
-
15
-
16
-
17
-
18
-
19
-
20
-
21
-
22
-
23
-
24
-
25
-
26
-
27
-
28
-
29
-
30
-
31
-
32
-
33
-
34
-
35
-
36
-
37
-
38
-
39
-
40
-
41
-
42
-
43
-
44
-
45
-
46
-
47
-
48
-
49
-
50
-
51
-
52
-
53
-
54
-
55
-
56
-
57
-
58
-
59
-
60
-
61
-
62
-
63
-
64
-
65
-
66
-
67
-
68
-
69
-
70
-
71
-
72
-
73
-
74
-
75
-
76
-
77
-
78
-
79
-
80
-
81
-
82
-
83
-
84
-
85
-
86
-
87
-
88
-
89
-
90
-
91
-
92
-
93
-
94
-
95
-
96
-
97
-
98
-
99
-
100
-
101
-
102
-
103
-
104
-
105
-
106
-
107
-
108
-
109
-
110
-
111
-
112
-
113
-
114
-
115
-
116
-
117
-
118
-
119
-
120
-
121
-
122
-
123
-
124
-
125
-
126
-
127
-
128
-
129
-
130
-
131
-
132
-
133
-
134
-
135
-
136
-
137
-
138
-
139
-
140
-
141
-
142
-
143
-
144
-
145
-
146
-
147
-
148
-
149
-
150
-
151
-
152
-
153
-
154
-
155
-
156
-
157
-
158
-
159
-
160
-
161
-
162
-
163
-
164
-
165
-
166
-
167
-
168
-
169
-
170
-
171
-
172
-
173
-
174
-
175
-
176
-
177
-
178
-
179
-
180
-
 181
181 -
 182
182 -
 183
183 -
 184
184 -
 185
185 -
 186
186 -
 187
187 -
 188
188 -
 189
189 -
 190
190 -
 191
191 -
 192
192 -
 193
193 -
 194
194 -
 195
195 -
 196
196 -
 197
197 -
 198
198 -
 199
199 -
 200
200 -
 201
201 -
202
-
203
-
204
-
205
-
206
-
207
-
208
-
209
-
210
-
211
-
212
-
213
-
214
-
215
-
216
-
217
-
218
-
219
-
220
-
221
-
222
-
223
-
224
-
225
-
226
-
227
-
228
-
229
-
230
-
231
-
232
-
233
-
234
-
235
-
236
-
237
-
238
-
239
-
240
-
241
-
242
-
243
-
244
-
245
-
246
-
247
-
248
-
249
-
250
-
251
-
252
-
253
-
254
-
255
-
256
-
257
-
258
-
259
-
260
-
261
-
262
-
263
-
264
-
265
-
266
-
267
-
268
-
269
-
270
-
271
-
272
-
273
-
274
-
275
-
276
-
277
-
278
-
279
-
280
-
281
-
282
-
283
-
284
-
285
-
286
-
287
-
288
-
289
-
290
-
291
-
292
-
293
-
294
-
295
-
296
-
297
-
298
-
299
-
300
-
301
-
302
-
303
-
304
-
305
-
306
-
307
-
308
-
309
-
310
-
311
-
312
-
313
-
314
-
315
-
316
-
317
-
318
-
319
-
320
-
321
-
322
-
323
-
324
-
325
-
326
-
327
-
328
-
329
-
330
-
331
-
332
-
333
-
334
-
335
-
336
-
337
-
338
-
339
-
340
-
341
-
342
-
343
-
344
-
345
-
346
-
347
-
348
-
349
-
350
-
351
-
352
-
353
-
354
-
355
-
356
 |
 |

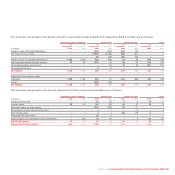
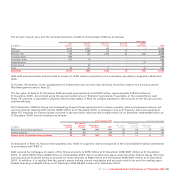
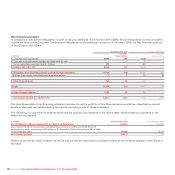
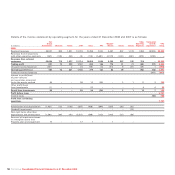
Net financial position
In compliance with Consob Regulation issued on 28 July 2006 and in conformity with CESR’s
Recommendations for the consistent
implementation of the European Commission’s Regulation on Prospectuses
issued on 10 February 2005, the Net financial position
of the Group is as follows:
At 31 December 2008 At 31 December 2007
of which of which
(€ millions) Related parties Related parties
A. Cash and cash equivalents 3,683 101 6,639 –
B. Cash and cash equivalents included as Assets held for sale ––2–
C. Current securities (securities held for trading) 177 – 291 –
D. Liquidity (A) + (B) + (C) 3,860 101 6,932 –
E. Receivables from financing activities (Current financial receivables) 13,136 134 12,268 331
- of which: From jointly controlled financial services entities 3381 81
F. Other financial assets 764 46 703 –
G. Debt 21,379 773 17,951 617
H. Other financial liabilities 1,202 95 188 –
I. Net financial position (I) = (D+E+F-G-H): (4,821) (587) 1,764 (286)
The item Receivables from financing activities includes the entire portfolio of the financial services entities, classified as current
assets as they will be realised during the normal operating cycle of these companies.
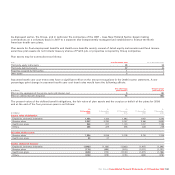
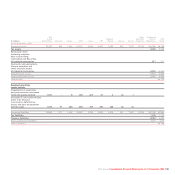
The following is reconciliation between Net financial position as presented in the above table and Net debt as presented in the
Report on Operations:
(€ millions) At 31 December 2008 At 31 December 2007
Consolidated net debt as presented in the Report on Operations (17,954) (10,423)
Less: Current financial receivables, excluding those due from jointly controlled financial
services companies amounting to €3 million at 31 December 2008 (amounting to €81 million
at 31 December 2007) 13,133 12,187
Net financial position (4,821) 1,764
Reference should be made to Notes 19, 20, 21 and 22 and the information provided in Note 27 for a further analysis of the items in
the table.
Fiat Group Consolidated Financial Statements at 31 December 2008190