Chrysler 2008 Annual Report Download - page 47
Download and view the complete annual report
Please find page 47 of the 2008 Chrysler annual report below. You can navigate through the pages in the report by either clicking on the pages listed below, or by using the keyword search tool below to find specific information within the annual report.-
 1
1 -
2
-
3
-
4
-
5
-
6
-
7
-
8
-
9
-
10
-
11
-
12
-
13
-
14
-
15
-
16
-
17
-
18
-
19
-
20
-
21
-
22
-
23
-
24
-
25
-
26
-
27
-
28
-
29
-
30
-
31
-
32
-
33
-
34
-
35
-
36
-
 37
37 -
 38
38 -
 39
39 -
 40
40 -
 41
41 -
 42
42 -
 43
43 -
 44
44 -
 45
45 -
 46
46 -
 47
47 -
 48
48 -
 49
49 -
 50
50 -
 51
51 -
 52
52 -
 53
53 -
 54
54 -
 55
55 -
 56
56 -
 57
57 -
58
-
59
-
60
-
61
-
62
-
63
-
64
-
65
-
66
-
67
-
68
-
69
-
70
-
71
-
72
-
73
-
74
-
75
-
76
-
77
-
78
-
79
-
80
-
81
-
82
-
83
-
84
-
85
-
86
-
87
-
88
-
89
-
90
-
91
-
92
-
93
-
94
-
95
-
96
-
97
-
98
-
99
-
100
-
101
-
102
-
103
-
104
-
105
-
106
-
107
-
108
-
109
-
110
-
111
-
112
-
113
-
114
-
115
-
116
-
117
-
118
-
119
-
120
-
121
-
122
-
123
-
124
-
125
-
126
-
127
-
128
-
129
-
130
-
131
-
132
-
133
-
134
-
135
-
136
-
137
-
138
-
139
-
140
-
141
-
142
-
143
-
144
-
145
-
146
-
147
-
148
-
149
-
150
-
151
-
152
-
153
-
154
-
155
-
156
-
157
-
158
-
159
-
160
-
161
-
162
-
163
-
164
-
165
-
166
-
167
-
168
-
169
-
170
-
171
-
172
-
173
-
174
-
175
-
176
-
177
-
178
-
179
-
180
-
181
-
182
-
183
-
184
-
185
-
186
-
187
-
188
-
189
-
190
-
191
-
192
-
193
-
194
-
195
-
196
-
197
-
198
-
199
-
200
-
201
-
202
-
203
-
204
-
205
-
206
-
207
-
208
-
209
-
210
-
211
-
212
-
213
-
214
-
215
-
216
-
217
-
218
-
219
-
220
-
221
-
222
-
223
-
224
-
225
-
226
-
227
-
228
-
229
-
230
-
231
-
232
-
233
-
234
-
235
-
236
-
237
-
238
-
239
-
240
-
241
-
242
-
243
-
244
-
245
-
246
-
247
-
248
-
249
-
250
-
251
-
252
-
253
-
254
-
255
-
256
-
257
-
258
-
259
-
260
-
261
-
262
-
263
-
264
-
265
-
266
-
267
-
268
-
269
-
270
-
271
-
272
-
273
-
274
-
275
-
276
-
277
-
278
-
279
-
280
-
281
-
282
-
283
-
284
-
285
-
286
-
287
-
288
-
289
-
290
-
291
-
292
-
293
-
294
-
295
-
296
-
297
-
298
-
299
-
300
-
301
-
302
-
303
-
304
-
305
-
306
-
307
-
308
-
309
-
310
-
311
-
312
-
313
-
314
-
315
-
316
-
317
-
318
-
319
-
320
-
321
-
322
-
323
-
324
-
325
-
326
-
327
-
328
-
329
-
330
-
331
-
332
-
333
-
334
-
335
-
336
-
337
-
338
-
339
-
340
-
341
-
342
-
343
-
344
-
345
-
346
-
347
-
348
-
349
-
350
-
351
-
352
-
353
-
354
-
355
-
356
 |
 |

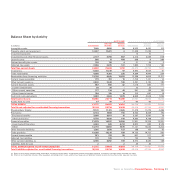
Report on Operations Financial Review – Fiat Group46
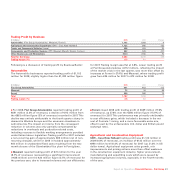
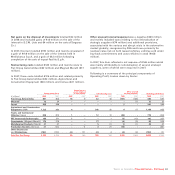
(€ millions) At 31.12.2008 At 31.12.2007 Change
Inventories (1) 10,501 8,958 1,543
Trade receivables 4,390 4,384 6
Trade payables (13,258) (14,725) 1,467
Net Current Taxes Receivable/(Payable) & Other Current Receivables/(Payables) (2) (890) (1,245) 355
Working capital 743 (2,628) 3,371
(1) Inventories are shown net of the value of vehicles sold under buy-back commitments by Fiat Group Automobiles.
(2) Other current Payables included under the item Other Current Taxes Receivable/(Payable) & Other Current Receivables/(Payables) excludes the buy-back price payable to customers upon expiration of
lease contracts and advanced payments from customers for vehicles sold under buy-back commitments, which is equal to the difference, at the date of signing the contract, between the initial sale
price and the buy-back price. Recognition of such amounts is apportioned over the entire term of the contract.
Consolidated Balance Sheet at 31 December 2008
At 31 December 2008, Total Assets amounted to €61,772
million, growing €1,636 million from the €60,136 million figure
at 31 December 2007.
For 2008, Non-Current Assets increased €2,531 million mainly
in relation to Property, Plant and Equipment (+€1,361 million),
Intangible Assets (+€525 million) and Deferred Tax Assets
(+€494 million).
The €1,361 million increase in Property, Plant and Equipment
was largely attributable to the surplus of capital expenditure
over depreciation and disposals (principally of vehicles sold by
Iveco under buy-back commitments), in addition to changes in
the scope of operations (accounting for approximately €340
million) principally consisting of the line-by-line consolidation of
the Ergom Group (producer of plastic components acquired at
the end of 2007 and consolidated from 2008) and Tritec Motors.
These positive components were partially offset by a negative
currency translation impact of approximately €500 million.
The €525 million increase in Intangible Assets was attributable
to changes in the scope of consolidation (approximately €42
million) with the remainder almost entirely attributable to the
net difference between capital expenditure (primarily
capitalised development costs) and amortisation and write-
downs for the period.
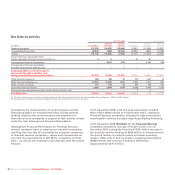
At 31 December 2008, Receivables from Financing Activities
totalled €13,136 million, an increase of €868 million over 31
December 2007. Net of currency translation differences and
write-downs, the increase amounted to €1,493 million, mainly
related to increased sales for CNH – Case New Holland, in
addition to continued strong sales volumes for FGA in Brazil
and growth in sales financing activities for Iveco in Eastern
Europe.
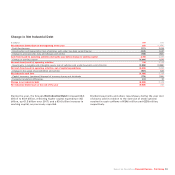
At 31 December 2008, Working Capital (net of items connected
with vehicles sold under buy-back commitments) was €743
million, a €3,371 million increase over the beginning of the
year (negative €2,628 million).
At 31 December 2008, Trade Receivables, Other Receivables
and Receivables from Financing Activities falling due after that
date and sold without recourse – and, therefore, eliminated
from the balance sheet pursuant to the derecognition
requirements of IAS 39 – totalled €5,825 million (€7,044 million
at 31 December 2007). This amount includes financial
receivables from the sales network, of €3,181 million (€3,817
million at 31 December 2007) sold to jointly-controlled
financial services companies (Fiat Group Automobile Financial
Services, now FGA Capital) and of €752 million (€869 million at
31 December 2007) sold to associate financial services
companies (Iveco Finance Holdings Limited, controlled by
Barclays).