Chrysler 2008 Annual Report Download - page 91
Download and view the complete annual report
Please find page 91 of the 2008 Chrysler annual report below. You can navigate through the pages in the report by either clicking on the pages listed below, or by using the keyword search tool below to find specific information within the annual report.-
 1
1 -
2
-
3
-
4
-
5
-
6
-
7
-
8
-
9
-
10
-
11
-
12
-
13
-
14
-
15
-
16
-
17
-
18
-
19
-
20
-
21
-
22
-
23
-
24
-
25
-
26
-
27
-
28
-
29
-
30
-
31
-
32
-
33
-
34
-
35
-
36
-
37
-
38
-
39
-
40
-
41
-
42
-
43
-
44
-
45
-
46
-
47
-
48
-
49
-
50
-
51
-
52
-
53
-
54
-
55
-
56
-
57
-
58
-
59
-
60
-
61
-
62
-
63
-
64
-
65
-
66
-
67
-
68
-
69
-
70
-
71
-
72
-
73
-
74
-
75
-
76
-
77
-
78
-
79
-
80
-
 81
81 -
 82
82 -
 83
83 -
 84
84 -
 85
85 -
 86
86 -
 87
87 -
 88
88 -
 89
89 -
 90
90 -
 91
91 -
 92
92 -
 93
93 -
 94
94 -
 95
95 -
 96
96 -
 97
97 -
 98
98 -
 99
99 -
 100
100 -
 101
101 -
102
-
103
-
104
-
105
-
106
-
107
-
108
-
109
-
110
-
111
-
112
-
113
-
114
-
115
-
116
-
117
-
118
-
119
-
120
-
121
-
122
-
123
-
124
-
125
-
126
-
127
-
128
-
129
-
130
-
131
-
132
-
133
-
134
-
135
-
136
-
137
-
138
-
139
-
140
-
141
-
142
-
143
-
144
-
145
-
146
-
147
-
148
-
149
-
150
-
151
-
152
-
153
-
154
-
155
-
156
-
157
-
158
-
159
-
160
-
161
-
162
-
163
-
164
-
165
-
166
-
167
-
168
-
169
-
170
-
171
-
172
-
173
-
174
-
175
-
176
-
177
-
178
-
179
-
180
-
181
-
182
-
183
-
184
-
185
-
186
-
187
-
188
-
189
-
190
-
191
-
192
-
193
-
194
-
195
-
196
-
197
-
198
-
199
-
200
-
201
-
202
-
203
-
204
-
205
-
206
-
207
-
208
-
209
-
210
-
211
-
212
-
213
-
214
-
215
-
216
-
217
-
218
-
219
-
220
-
221
-
222
-
223
-
224
-
225
-
226
-
227
-
228
-
229
-
230
-
231
-
232
-
233
-
234
-
235
-
236
-
237
-
238
-
239
-
240
-
241
-
242
-
243
-
244
-
245
-
246
-
247
-
248
-
249
-
250
-
251
-
252
-
253
-
254
-
255
-
256
-
257
-
258
-
259
-
260
-
261
-
262
-
263
-
264
-
265
-
266
-
267
-
268
-
269
-
270
-
271
-
272
-
273
-
274
-
275
-
276
-
277
-
278
-
279
-
280
-
281
-
282
-
283
-
284
-
285
-
286
-
287
-
288
-
289
-
290
-
291
-
292
-
293
-
294
-
295
-
296
-
297
-
298
-
299
-
300
-
301
-
302
-
303
-
304
-
305
-
306
-
307
-
308
-
309
-
310
-
311
-
312
-
313
-
314
-
315
-
316
-
317
-
318
-
319
-
320
-
321
-
322
-
323
-
324
-
325
-
326
-
327
-
328
-
329
-
330
-
331
-
332
-
333
-
334
-
335
-
336
-
337
-
338
-
339
-
340
-
341
-
342
-
343
-
344
-
345
-
346
-
347
-
348
-
349
-
350
-
351
-
352
-
353
-
354
-
355
-
356
 |
 |

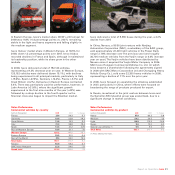
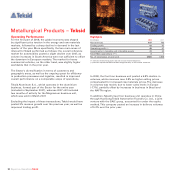
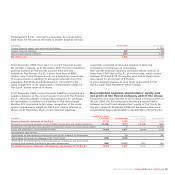
Report on Operations Teksid90
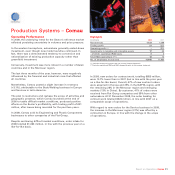
Operating Performance
For the first part of 2008, the global economy was shaped
by significant price tension in the energy and raw materials
markets, followed by a sharp decline in demand in the last
quarter of the year. More specifically, the two main areas of
interest for Teksid performed as follows: the overall reference
market for automobiles posted a slight decline over 2007, as
volume increases in South America were not sufficient to offset
the downturn in European markets. The market for heavy
commercial vehicles, on the other hand, was slightly higher
worldwide that in the prior year.
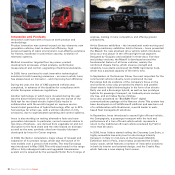
The Sector’s diversification in terms of customers and
geographic areas, as well as the ongoing quest for efficiency
in production processes and logistics, resulted in improved
overall performance on a comparable scope of operations.
Teksid Aluminum S.r.l., which operates in the aluminium
business, formed part of the Sector for the entire year
(included in September 2007), whereas 2007 still included
two months of activity for the Magnesium business unit,
which was sold in March 2007.
Excluding the impact of these transactions, Teksid would have
posted 3% revenue growth over the previous year, as well as
improved trading profit.
In 2008, the Cast Iron business unit posted a 6.8% decline in
volumes, while revenues rose 2.9% as higher selling prices
compensated for increased raw materials prices. The decrease
in volumes was mainly due to lower sales levels in Europe
(-7.7%), partially offset by increases in business in Brazil and
the NAFTA region.
In addition, Teksid’s Cast Iron business unit operates in China
through Hua Dong Teksid Automotive Foundry Co. Ltd., a joint
venture with the SAIC group, accounted for under the equity
method. This company posted an increase in delivery volumes
of 5.2% over the prior year.
Highlights
(€ millions) 2008 2007
Net revenues 837 783
Trading profit 41 47
Operating profit (*) 49 47
Investments in tangible and intangible assets 41 32
Total R&D expenditure (**) 31
No. of employees at year end 7, 6 0 0 7,826
(*) Includes restructuring costs and net unusual income/(expense).
(**)Includes capitalised R&D and R&D charged directly to the income statement.
Metallurgical Products – Teksid