Chrysler 2008 Annual Report Download - page 140
Download and view the complete annual report
Please find page 140 of the 2008 Chrysler annual report below. You can navigate through the pages in the report by either clicking on the pages listed below, or by using the keyword search tool below to find specific information within the annual report.-
 1
1 -
2
-
3
-
4
-
5
-
6
-
7
-
8
-
9
-
10
-
11
-
12
-
13
-
14
-
15
-
16
-
17
-
18
-
19
-
20
-
21
-
22
-
23
-
24
-
25
-
26
-
27
-
28
-
29
-
30
-
31
-
32
-
33
-
34
-
35
-
36
-
37
-
38
-
39
-
40
-
41
-
42
-
43
-
44
-
45
-
46
-
47
-
48
-
49
-
50
-
51
-
52
-
53
-
54
-
55
-
56
-
57
-
58
-
59
-
60
-
61
-
62
-
63
-
64
-
65
-
66
-
67
-
68
-
69
-
70
-
71
-
72
-
73
-
74
-
75
-
76
-
77
-
78
-
79
-
80
-
81
-
82
-
83
-
84
-
85
-
86
-
87
-
88
-
89
-
90
-
91
-
92
-
93
-
94
-
95
-
96
-
97
-
98
-
99
-
100
-
101
-
102
-
103
-
104
-
105
-
106
-
107
-
108
-
109
-
110
-
111
-
112
-
113
-
114
-
115
-
116
-
117
-
118
-
119
-
120
-
121
-
122
-
123
-
124
-
125
-
126
-
127
-
128
-
129
-
 130
130 -
 131
131 -
 132
132 -
 133
133 -
 134
134 -
 135
135 -
 136
136 -
 137
137 -
 138
138 -
 139
139 -
 140
140 -
 141
141 -
 142
142 -
 143
143 -
 144
144 -
 145
145 -
 146
146 -
 147
147 -
 148
148 -
 149
149 -
 150
150 -
151
-
152
-
153
-
154
-
155
-
156
-
157
-
158
-
159
-
160
-
161
-
162
-
163
-
164
-
165
-
166
-
167
-
168
-
169
-
170
-
171
-
172
-
173
-
174
-
175
-
176
-
177
-
178
-
179
-
180
-
181
-
182
-
183
-
184
-
185
-
186
-
187
-
188
-
189
-
190
-
191
-
192
-
193
-
194
-
195
-
196
-
197
-
198
-
199
-
200
-
201
-
202
-
203
-
204
-
205
-
206
-
207
-
208
-
209
-
210
-
211
-
212
-
213
-
214
-
215
-
216
-
217
-
218
-
219
-
220
-
221
-
222
-
223
-
224
-
225
-
226
-
227
-
228
-
229
-
230
-
231
-
232
-
233
-
234
-
235
-
236
-
237
-
238
-
239
-
240
-
241
-
242
-
243
-
244
-
245
-
246
-
247
-
248
-
249
-
250
-
251
-
252
-
253
-
254
-
255
-
256
-
257
-
258
-
259
-
260
-
261
-
262
-
263
-
264
-
265
-
266
-
267
-
268
-
269
-
270
-
271
-
272
-
273
-
274
-
275
-
276
-
277
-
278
-
279
-
280
-
281
-
282
-
283
-
284
-
285
-
286
-
287
-
288
-
289
-
290
-
291
-
292
-
293
-
294
-
295
-
296
-
297
-
298
-
299
-
300
-
301
-
302
-
303
-
304
-
305
-
306
-
307
-
308
-
309
-
310
-
311
-
312
-
313
-
314
-
315
-
316
-
317
-
318
-
319
-
320
-
321
-
322
-
323
-
324
-
325
-
326
-
327
-
328
-
329
-
330
-
331
-
332
-
333
-
334
-
335
-
336
-
337
-
338
-
339
-
340
-
341
-
342
-
343
-
344
-
345
-
346
-
347
-
348
-
349
-
350
-
351
-
352
-
353
-
354
-
355
-
356
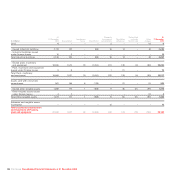
 |
 |

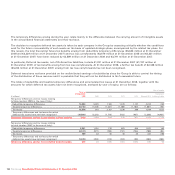
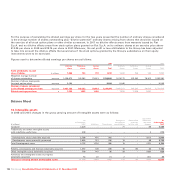
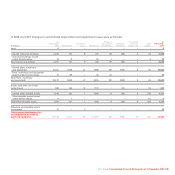
Translation
At Changes in Reclassified differences At
31 December Impairment the scope of to Assets and other 31 December
(€ millions) 2006 Additions Amortisation losses Divestitures consolidation held for sale changes 2007
Goodwill 2,850 – – (1) – 56 – (181) 2,724
Trademarks and other intangible assets
with indefinite useful lives 179 2 – – – – – (19) 162
- Development costs externally acquired 1,375 430 (320) (25) – – – (32) 1,428
- Development costs internally generated 1,401 502 (365) (17) (24) – – 37 1,534
Total Development costs 2,776 932 (685) (42) (24) – – 5 2,962
Patents, concessions and licenses
externally acquired 436 87 (136) – (1) 1 – 5 392
Other intangible assets externally
acquired 128 97 (59) (3) (3) 30 – 39 229
Advances and intangible assets
in progress externally acquired 52 20 – – (2) – – (16) 54
Total net carrying amount
of Intangible assets 6,421 1,138 (880) (46) (30) 87 –(167) 6,523
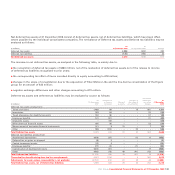
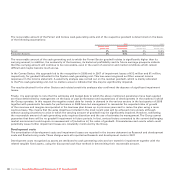
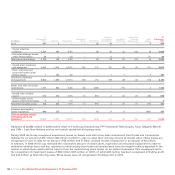
The increase of €42 million in net intangible assets in 2008 arising from the Change in the scope of consolidation consists mainly
of €41 million deriving from the consolidation on a line-by-line basis of the Ergom Group and €1 million from the acquisition of
Tritec Motors Ltda (now FPT Powertrain do Brasil – Industria e Comércio de Motores Ltda). In 2007 the change in the scope
of consolidation arose from the following purchases: After Market Parts and Services group €63 million, I.T.C.A. group €13 million
and Teksid Aluminum S.r.l. €7 million.
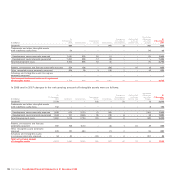
Foreign exchange gains of €6 million in 2008 (losses of €216 million in 2007) principally reflect changes in the Euro/U.S. dollar,
Euro/Real, Euro/Zloty and Euro/Canadian dollar exchange rate. Included in the column Translation differences and Other changes is
the reversal of previously recognised impairment losses for €17 million. In 2007 this item included a reclassification of €57 million
of expenditure on software previously erroneously reported as Property, plant and equipment.
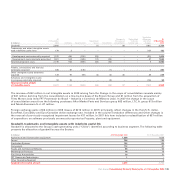
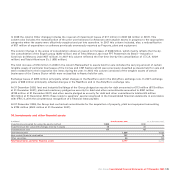
Goodwill, trademarks and intangible assets with indefinite useful life
Goodwill is allocated to the Group’s cash-generating units (“CGUs”) identified according to business segment. The following table
presents the allocation of goodwill across the Sectors:
(€ millions) At 31 December 2008 At 31 December 2007
Agricultural and Construction equipment 1,699 1,626
Ferrari 786 786
Production Systems 133 138
Component 112 87
Trucks and Commercial Vehicles 56 56
Metallurgical Products 18 18
Fiat Group Automobiles 10 10
FPT Powertrain Technologies 1–
Other Operating Segment –3
Goodwill net carrying amount 2,815 2,724
Fiat Group Consolidated Financial Statements at 31 December 2008 139